📰 Trending Topics
Google News - Trending
Google News - Technology
I finally got the $499 Trump Phone. It's the worst Android phone I've used in 2026 - Android Authority
2026-07-10 09:30
- I finally got the $499 Trump Phone. It's the worst Android phone I've used in 2026 Android Authority
- I spent a week using the Trump phone — it sucks The Verge
- Trump Mobile Wants To Entice You To Buy The “Yellow Plastic” T1 Phone By Offering A Free Charging Brick Wccftech
- Trump Mobile's First Smartphone "T1" Tested: Harsh Reality Revealed — Half the Performance of Pixel 10a, Less Than One-Fifth the Brightness finance.biggo.com
- I finally got my Trump phone The Verge
HP OmniBook Ultra 14 Review: HP's Best Ultraportable In Years - Engadget
2026-07-10 13:00
- HP OmniBook Ultra 14 Review: HP's Best Ultraportable In Years Engadget
- I tried the best-looking laptop of 2026, and its battery life was the real surprise ZDNET
- HP OmniBook X Flip 14 comes in AMD and Intel flavors, but our pick is obvious Notebookcheck
- HP OmniBook Ultra 14 Specs, Price, and Benchmarks Memeburn
- I don't care about looks, just function, and this laptop delivers on the latter Windows Central
Men found ‘Love Island.’ Then they started betting on it. - Yahoo
2026-07-10 15:47
Xreal’s new AR glasses are way cheaper and almost just right - The Verge
2026-07-10 13:00
- Xreal’s new AR glasses are way cheaper and almost just right The Verge
- Xreal's New $299 Display Glasses Might Be My Budget Favorites, but I Miss the Extras CNET
- X by Xreal a01+ Review: AR Glasses That Are Light on Your Face (and Wallet) Gizmodo
- Xreal's $299 Lightweight a01+ AR Glasses Are Now Available To Buy Engadget
- X by Xreal is the first affordable pair of smart glasses that don't feel like a compromise Android Central
iPhone 18 Pro Max component costs could jump by nearly $300, per report - 9to5Mac
2026-07-09 15:58
- iPhone 18 Pro Max component costs could jump by nearly $300, per report 9to5Mac
- Infographic: iPhone 17 Pro Max vs iPhone 18 Pro Max (E) BoM Cost Comparison Counterpoint Research
- iPhone 18 Pro Max could cost Apple $300 more to make AppleInsider
- Even with a big price hike, the iPhone 18 Pro Max could be less profitable than the 17 Pro Max PhoneArena
- NAND Becomes The Biggest Cost Component For Apple’s iPhone 18 Pro Max (1TB) At Over $250 Per Unit Wccftech
NASA - Breaking News
Waxing Gibbous Moon
2026-07-10 15:08
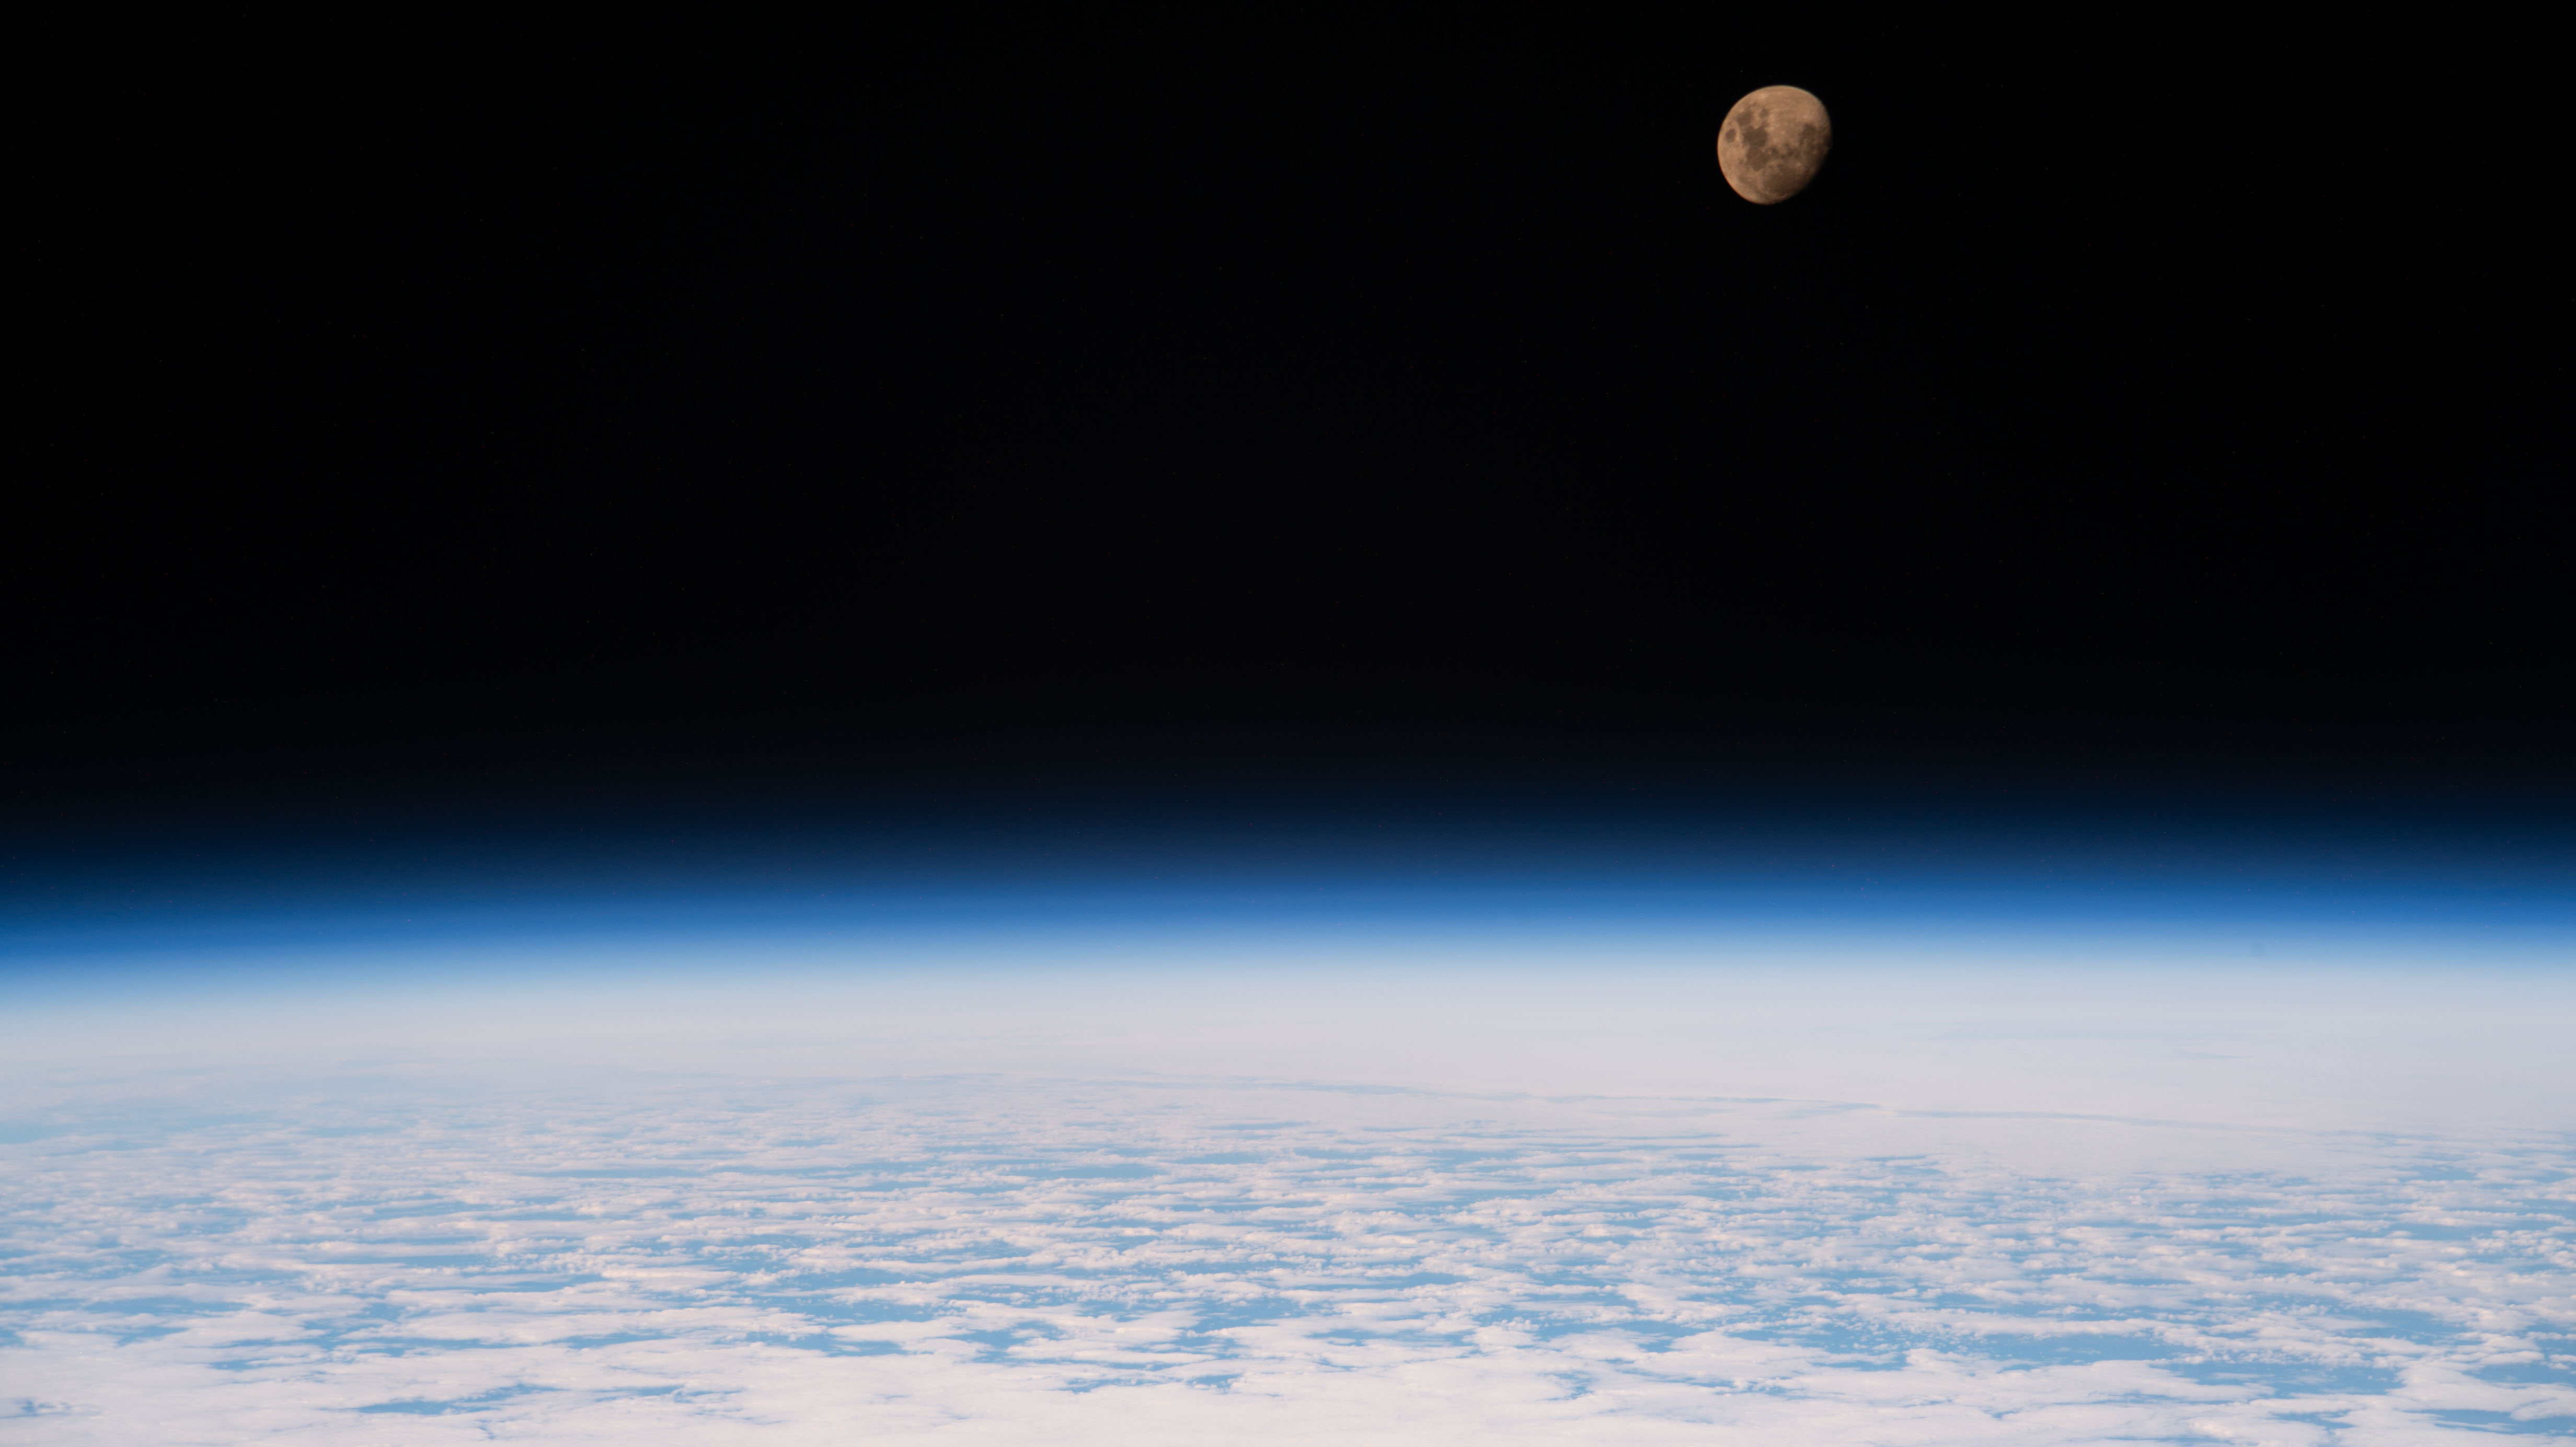
The waxing gibbous moon is nestled in the darkness of space in this June 26, 2026, image from the International Space Station. The space station was 264 miles above the Indian Ocean southeast of Madagascar at the time.
The waxing gibbous phase comes before the full moon phase. During this time, the Moon appears brighter in the night sky to viewers on Earth.
Image credit: NASA
Where Venezuela’s Earthquakes Shifted the Ground
2026-07-10 04:00
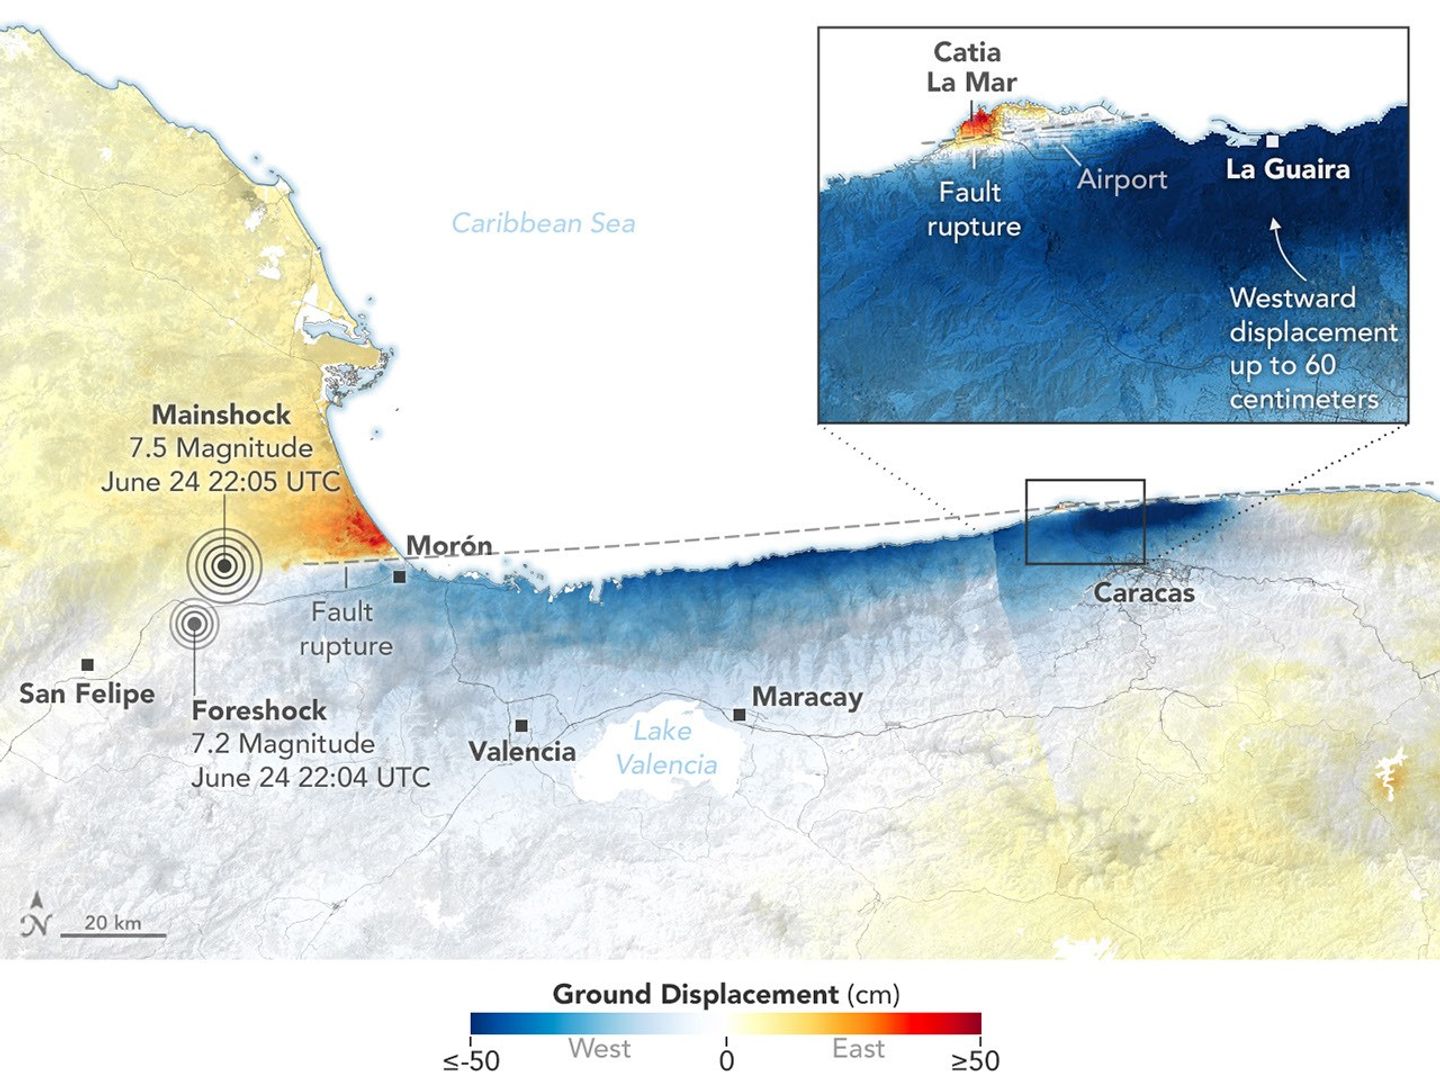
On June 24, 2026, a magnitude 7.2 earthquake struck northern Venezuela, followed under a minute later by a magnitude 7.5 mainshock. Together, the quakes left immense damage and loss of life across the region. In the days that followed, satellite-based maps of ground displacement revealed how the land surface moved, providing insight into the forces behind the severe destruction in locations such as La Guaira and other coastal cities in La Guaira state.
This map was produced using data from the NISAR (NASA-ISRO Synthetic Aperture Radar) satellite and processed by the NISAR science team at NASA’s Jet Propulsion Laboratory (JPL). Scientists used a technique called InSAR, which compares data from repeat passes to detect subtle changes in the distance between the satellite and the ground. Images acquired on June 25 and June 30, after the quakes, were compared with images from June 13 and June 18, before the quakes.
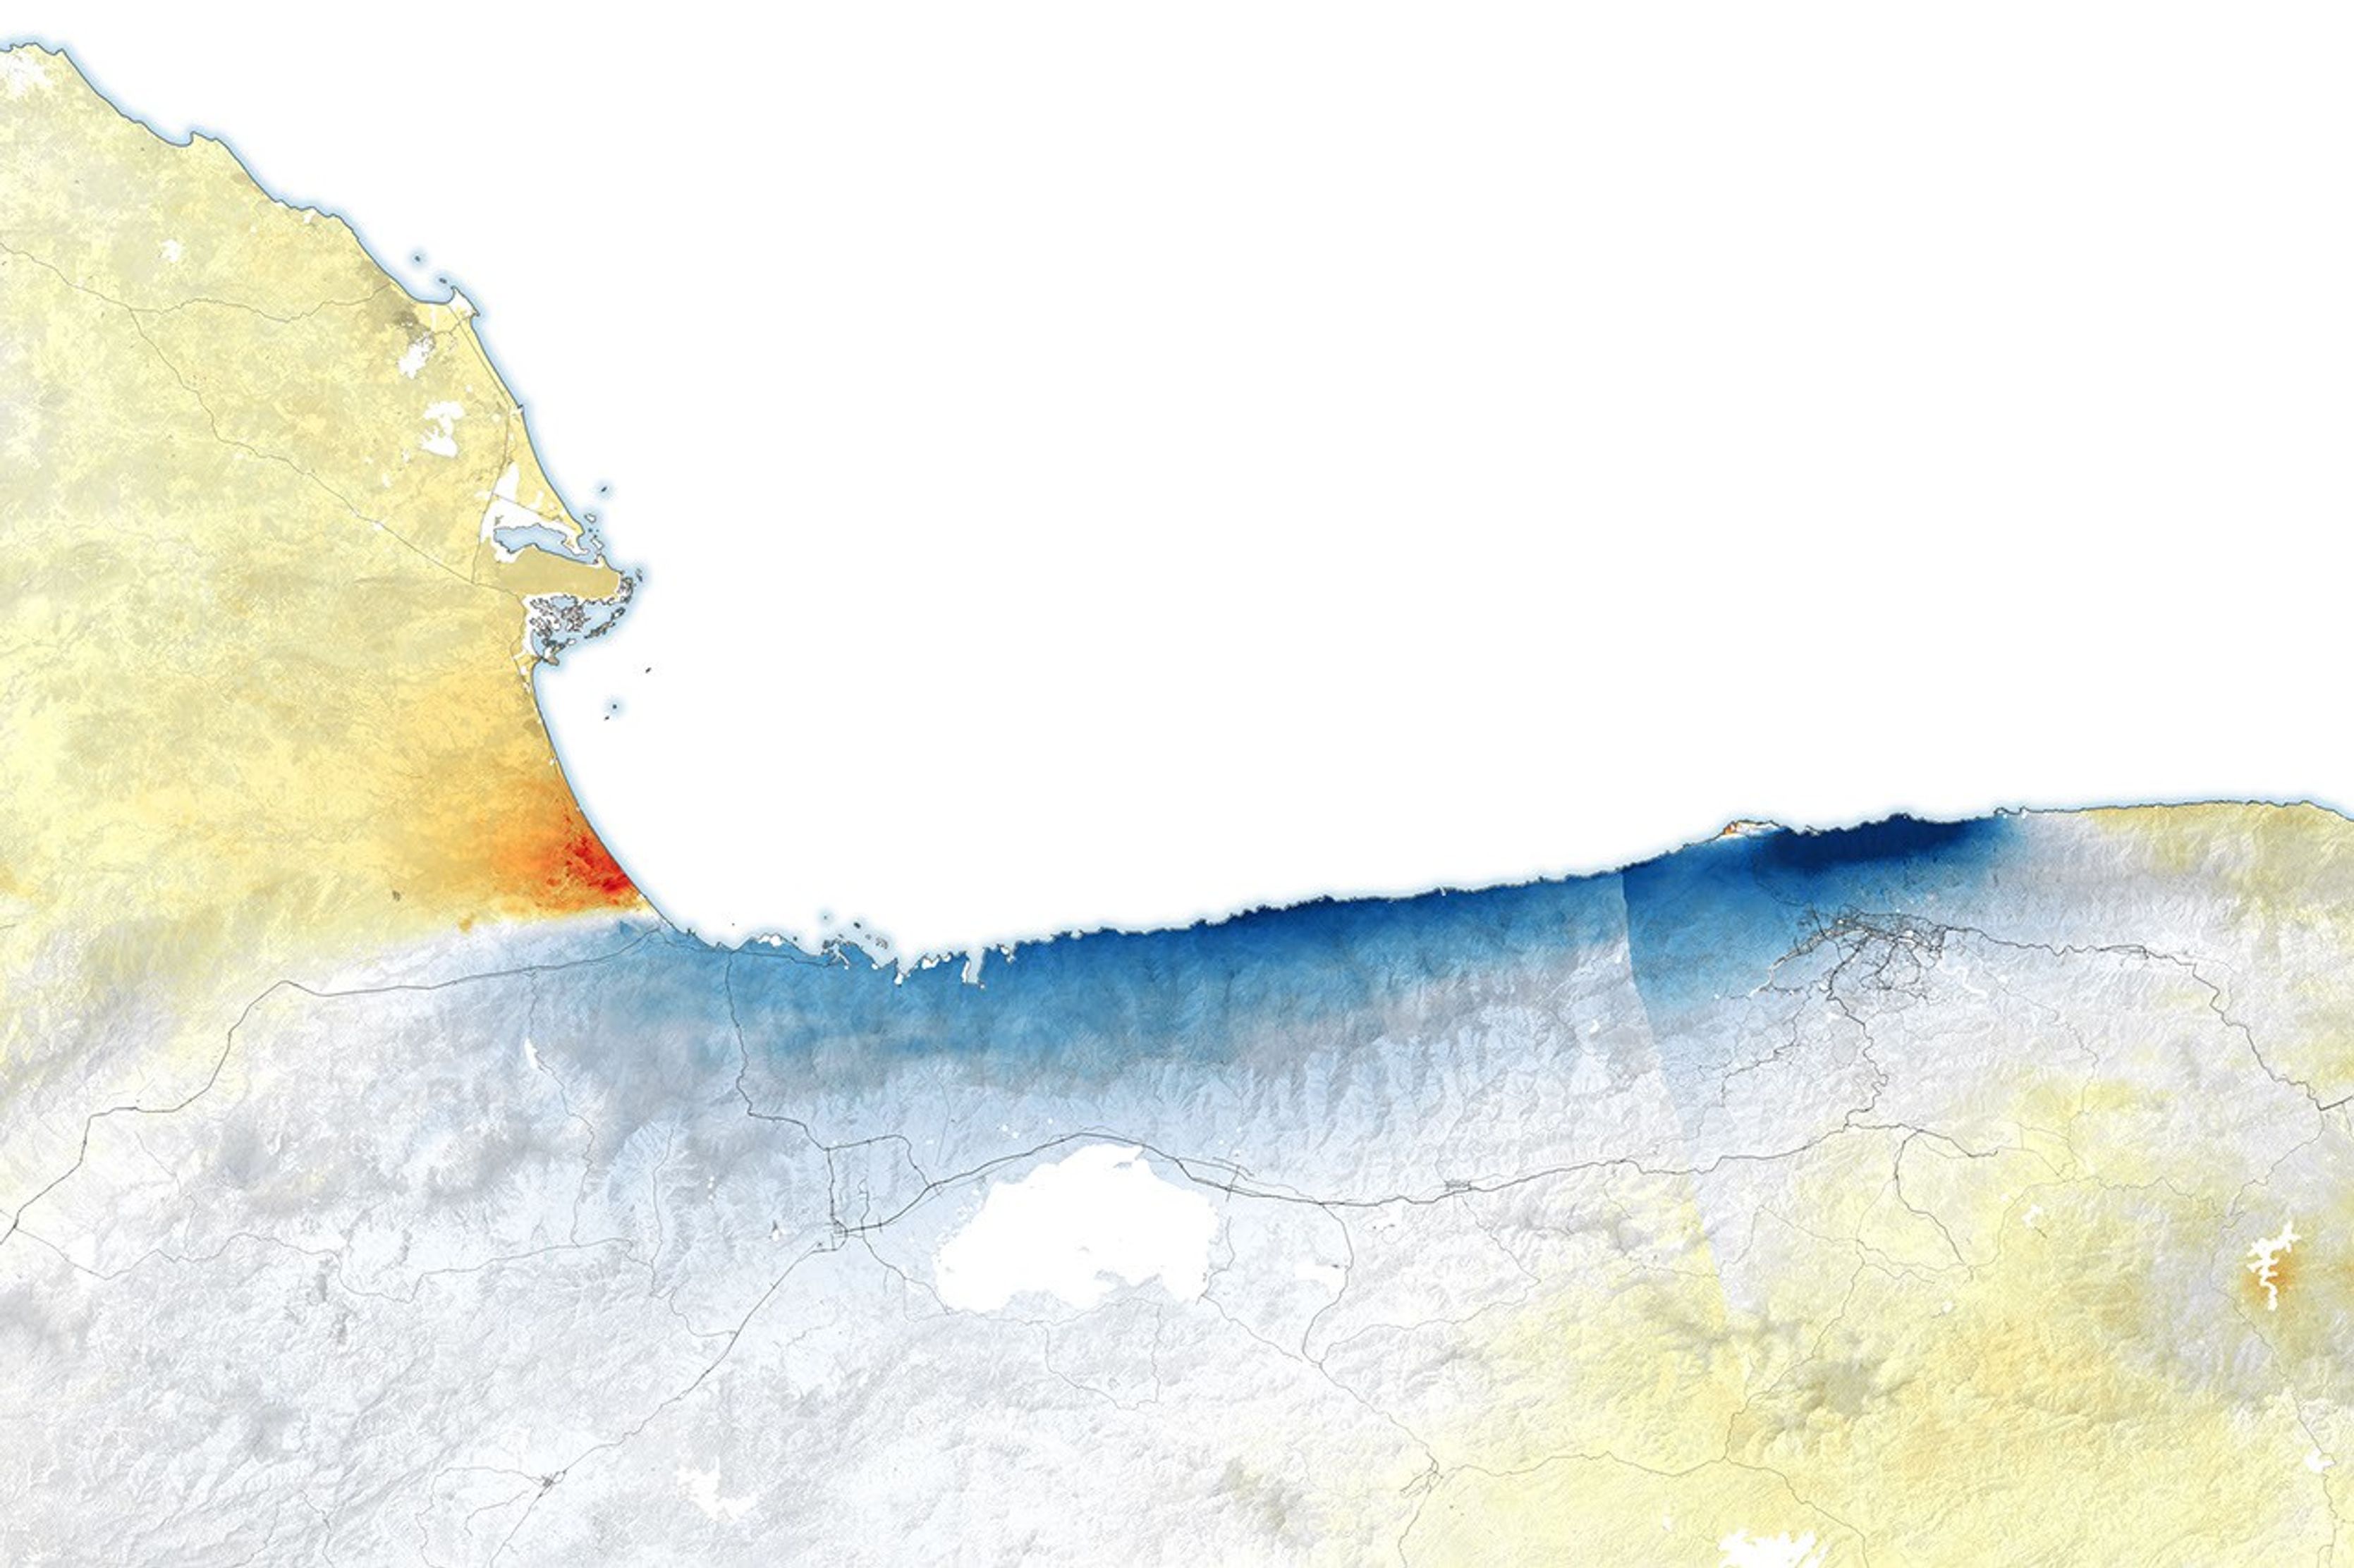
NISAR views Earth at an angle, about 40 degrees from straight down, allowing it to capture a mix of horizontal and vertical displacement. In this map, red areas show where the ground moved east and up; blue areas moved west and down. Because the earthquake occurred on a strike-slip fault, however, most of the displacement shown in this map was horizontal (east and west).
White areas indicate little to no land displacement, including a thin strip near the middle-left of the scene, close to Morón, marking roughly where the fault ruptured at depth. The fault is part of a network of fractures that lies along the boundary between the Caribbean plate to the north and the South American plate to the south. Scientists say faults along this plate boundary, including the San Sebastián fault system where these quakes likely occurred (and possibly part of the Boconó system), have long been accumulating strain.
The fault rupture propagated offshore, toward the east, and then back onshore near the international airport north of Caracas, marked by the narrow white band visible between westward and eastward displacement. Just south of this fault section, the deep blue color indicates that the westward surface displacement along this part of the fault was far greater than elsewhere, reaching as much as 60 centimeters (24 inches).
“These are reasons why the damage in Caracas and La Guaira was so extreme,” said Eric Fielding, a geophysicist at JPL who provided the maps. “InSAR tells us a lot about what happened during this earthquake.”
Using the NISAR data, the U.S. Geological Survey refined its fault-slip model, or “finite fault model,” to better constrain how the fault slipped at depth, including along the rupture’s eastern section. “That is extremely helpful for the people who need to understand why damage was so severe in that area,” Fielding said.
The displacement maps for this event were provided through NISAR’s Urgent Response (UR) system, a fast-track process that can deliver data within 12 to 24 hours to support disaster response. The rapid processing relies on predicted orbit information, so UR maps are preliminary until they are later reprocessed with precise orbit information, typically within a day or two. This marks the first time the NISAR UR system has been used to map surface displacement from a large earthquake.
NASA Earth Observatory map by Lauren Dauphin, using data provided Eric Fielding and processed by the NISAR science team at NASA’s Jet Propulsion Laboratory (JPL). Story by Kathryn Hansen.
References & Resources
- NASA (2025, July 23) Interferometry. Accessed July 9, 2026.
- NASA Earth Observatory, (2025, September 15) Mapping Kamchatka Earthquake Displacement. Accessed July 9, 2026.
- NASA Earth Observatory, (2025, April 15) Satellite Data Show Motion of Burma Earthquakes. Accessed July 9, 2026.
- NASA’s Disasters Mapping Portal (2026, July 9) Venezuela Earthquake June 2026. Accessed July 9, 2026.
- U.S. Geological Survey (2026, June 24) M 7.2 – 21 km ENE of San Felipe, Venezuela. Accessed July 9, 2026.
- U.S. Geological Survey (2026, June 24) M 7.5 – 20 km ESE of Yumare, Venezuela. Accessed July 9, 2026.
You may also be interested in:
Stay up-to-date with the latest content from NASA as we explore the universe and discover more about our home planet.

An astronaut’s photo, taken en route to the Moon, reveals our planet and its place in space in a novel…

Antarctic Iceberg A-23A’s journey ends in fragmentation in the South Atlantic Ocean, after a 40-year lifespan documented by satellites.

Over the years, astronauts aboard the International Space Station have photographed several of the cities hosting the 2026 FIFA World…


NASA Sets Coverage for Astronaut Anil Menon Launch to Space Station
2026-07-09 22:09

NASA astronaut Anil Menon will launch aboard the Roscosmos Soyuz MS-29 spacecraft to the International Space Station on Tuesday, July 14, accompanied by cosmonauts Pyotr Dubrov and Anna Kikina, where they will join the Expedition 74 crew advancing scientific research.
Menon, Dubrov, and Kikina will lift off at 10:47 a.m. EDT (7:47 p.m. Baikonur time) from the Baikonur Cosmodrome in Kazakhstan. Live launch and docking coverage is available on NASA+, Amazon Prime, and the agency’s YouTube channel. Learn how to watch NASA content through a variety of online platforms, including social media.
After a two-orbit, three-hour trip to the station, the spacecraft will automatically dock at 1:56 p.m. to the Prichal module. Shortly afterward, hatches will open between the Soyuz and the orbiting laboratory.
Once aboard, the trio will join NASA astronauts Jessica Meir, Jack Hathaway, and Chris Williams, ESA (European Space Agency) astronaut Sophie Adenot, and Roscosmos cosmonauts Sergey Kud-Sverchkov, Sergei Mikaev, and Andrey Fedyaev.
NASA’s coverage schedule is as follows (all times Eastern and subject to change based on real-time operations):
Tuesday, July 14
9:45 a.m. – Launch coverage begins on NASA+, Amazon Prime, and YouTube.
10:47 a.m. – Launch
1:10 p.m. – Rendezvous and docking coverage begins on NASA+, Amazon Prime, and YouTube.
1:56 p.m. – Docking
3:30 p.m. – Hatch opening and welcome coverage begins on NASA+, Amazon Prime, and YouTube.
3:55 p.m. – Hatch opening
Menon, Dubrov, and Kikina will spend about eight months aboard the orbital complex as International Space Station Expedition 74/75 crew members before returning to Earth in April 2027. This will be Menon’s first spaceflight and the second for both Dubrov and Kikina.
During his stay on the station, Menon will conduct scientific research and technology demonstrations aimed at advancing human space exploration and benefiting life on Earth. He will continue research to refine in-space production of semiconductor crystals to enable the large-scale manufacturing of components needed for high-performance computers, artificial intelligence, and improved medical devices. Menon also will perform ultrasound using augmented reality and artificial intelligence methods that could eliminate the need for medical support from Earth on future space missions. He will be a test subject helping researchers understand how blood flow is affected in space to protect future astronauts. He also will test bioprinting vascular constructs in microgravity to improve understanding of the aging process to advance therapeutic developments.
For more than 25 years, people have lived and worked continuously aboard the International Space Station, advancing scientific knowledge and making research breakthroughs not possible on Earth. The space station helps NASA understand and overcome the challenges of human spaceflight, expand commercial opportunities in low Earth orbit, and build on the foundation for long-duration missions to the Moon, as part of the Artemis program, and to Mars.
To learn more about International Space Station research, operations, and its crews, visit:
-end-
Joshua Finch / Jimi Russell
Headquarters, Washington
202-358-1100
joshua.a.finch@nasa.gov / james.j.russell@nasa.gov
Sandra Jones
Johnson Space Center, Houston
281-483-5111
sandra.p.jones@nasa.gov
NASA Space Telescope Maps Magnetic Fields of ‘Lighthouse’ Pulsar
2026-07-09 20:08
NASA Space Telescope Maps Magnetic Fields of ‘Lighthouse’ Pulsar
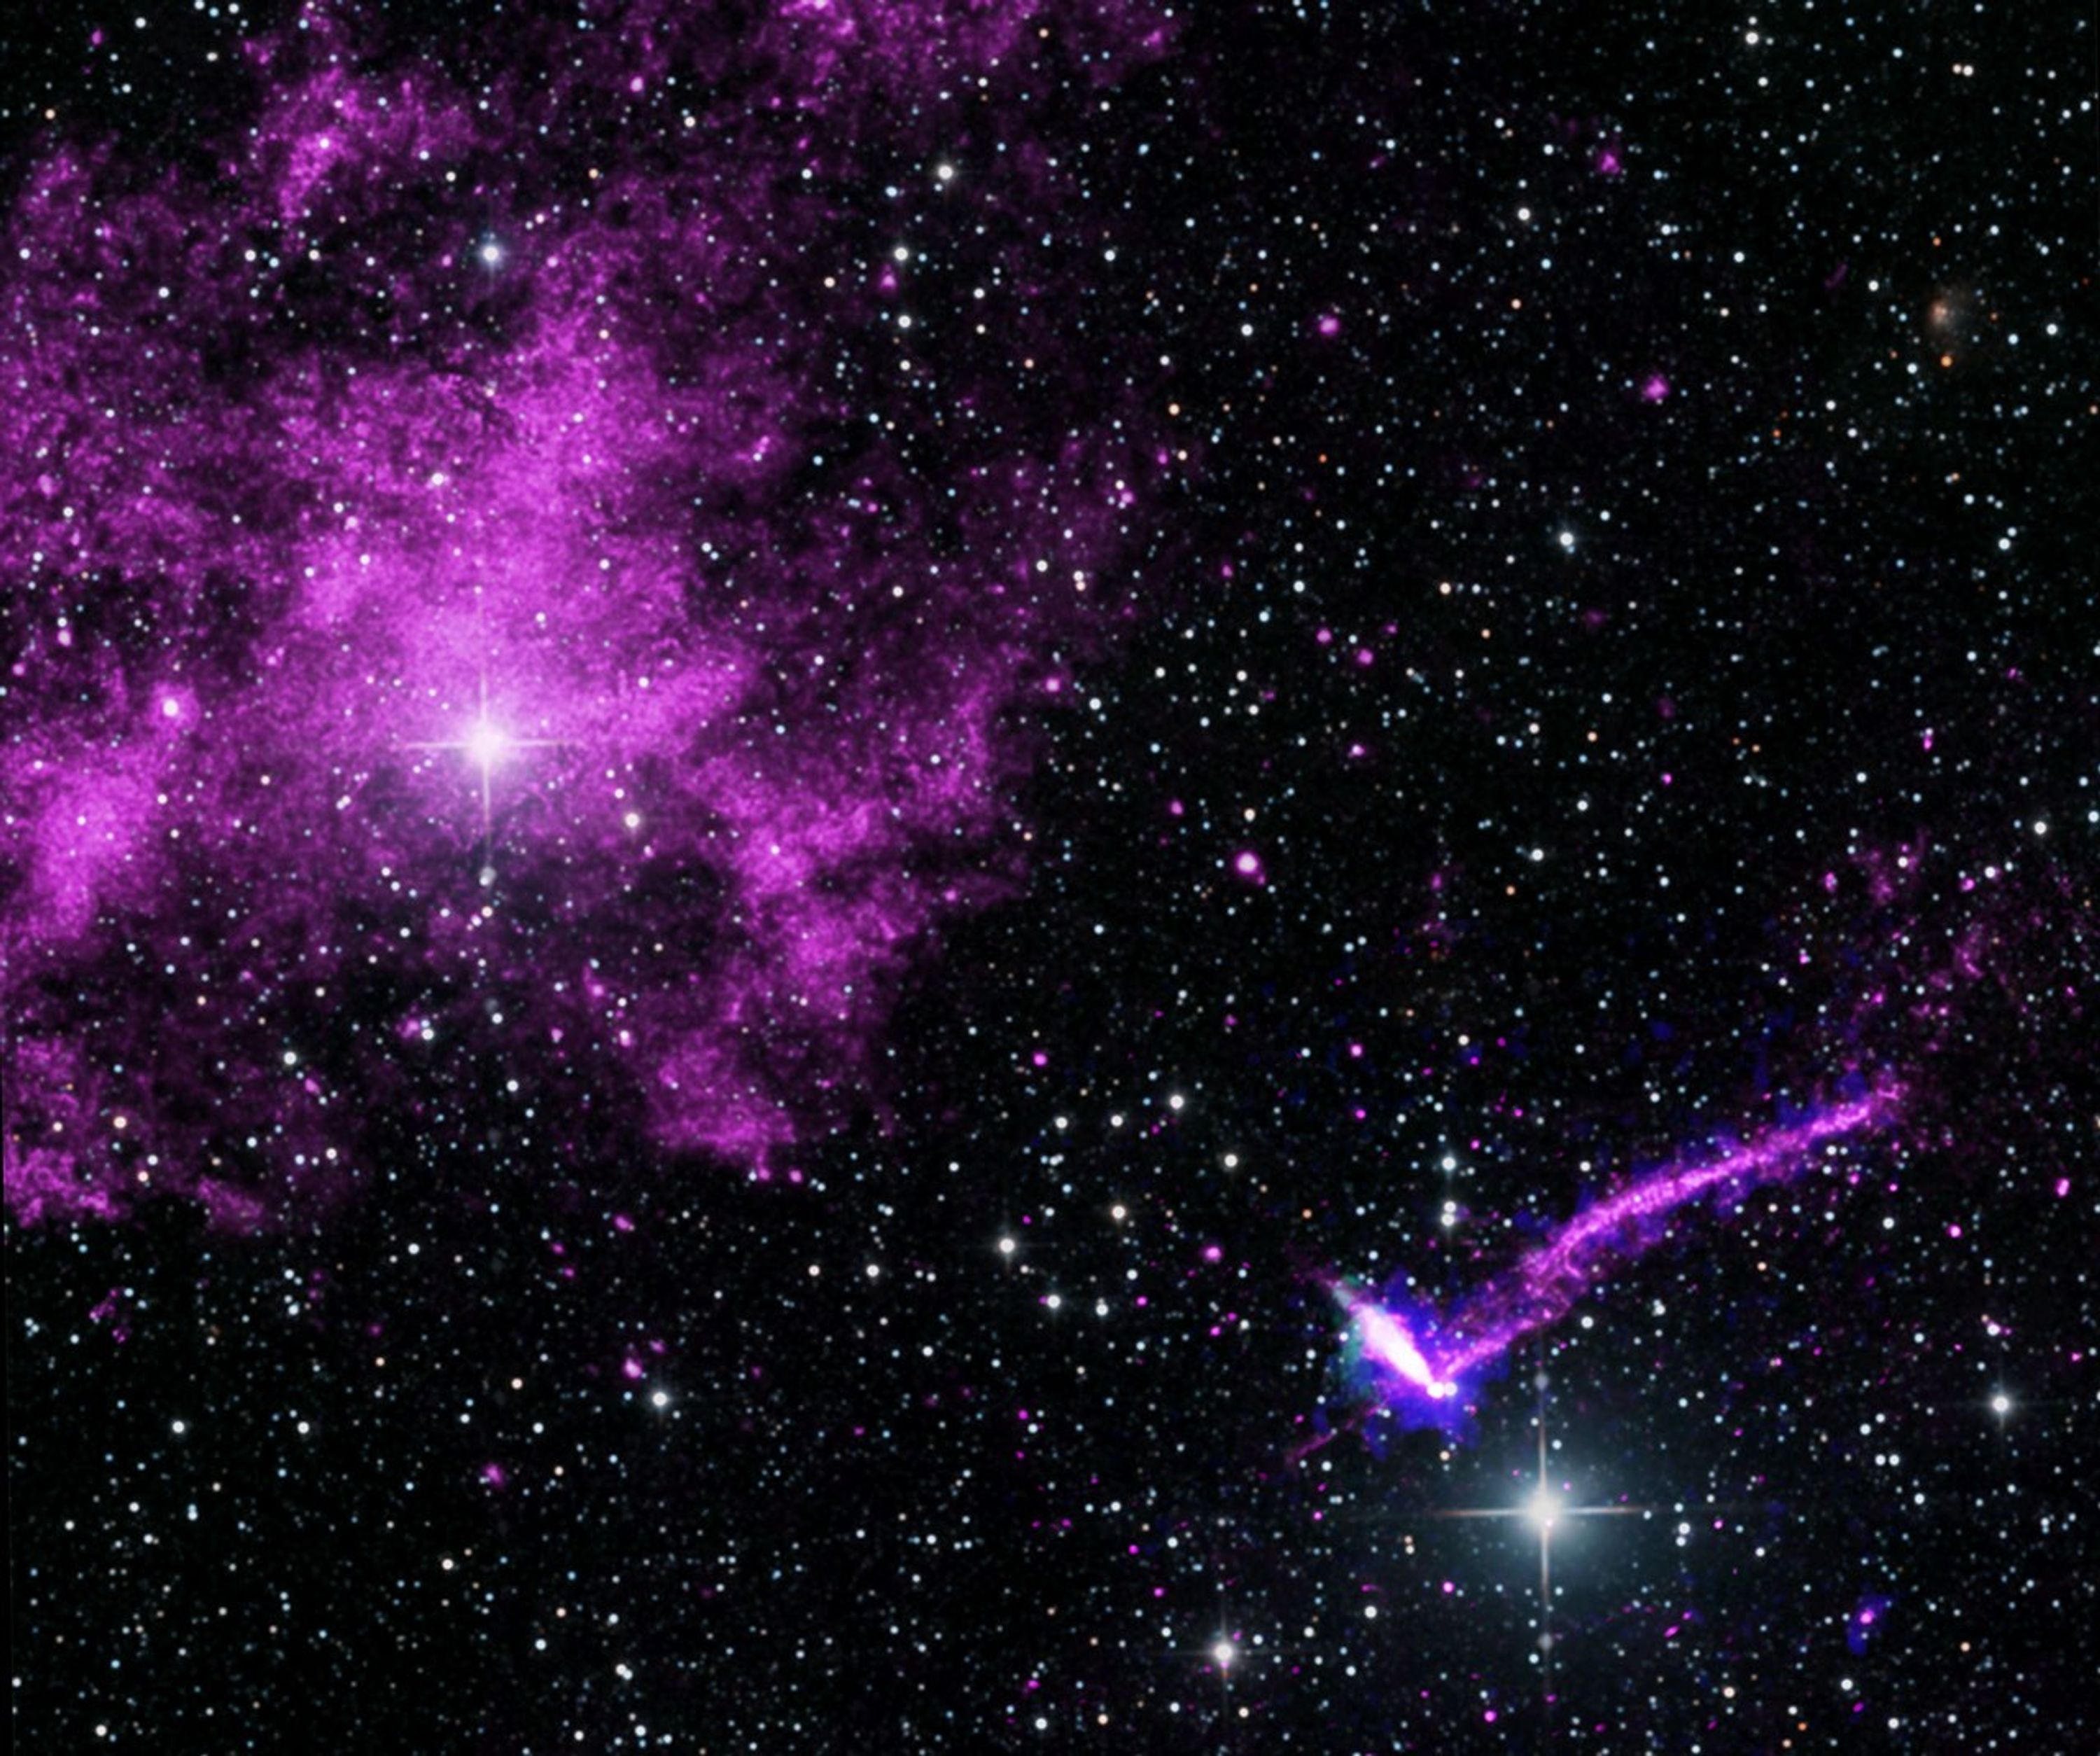
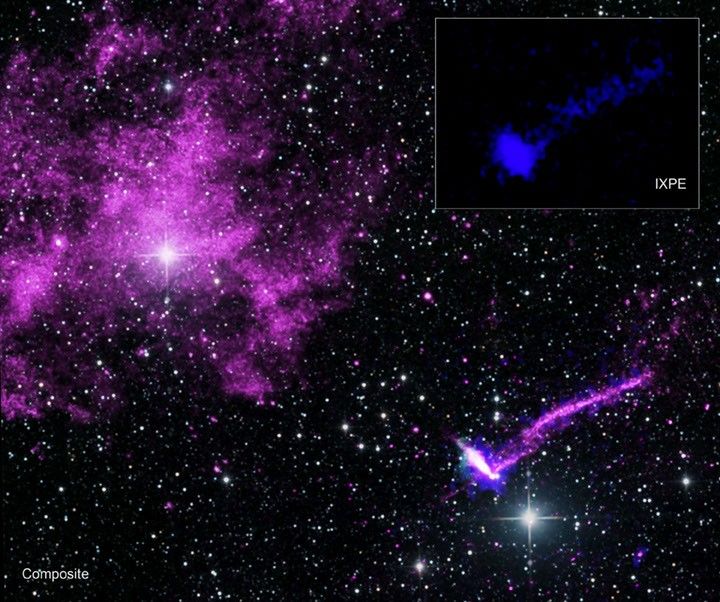
For the first time, scientists have used NASA’s IXPE (Imaging X-ray Polarimetry Explorer) to directly measure the magnetic fields of PSR J1101−6101, a pulsar located within what is often referred to as the Lighthouse Nebula. The results provide new insight into the structure of some of the most extreme objects in the cosmos, as NASA continues to explore the secrets of how the universe works. A paper describing the results published Thursday in the Astrophysical Journal.
Fast facts
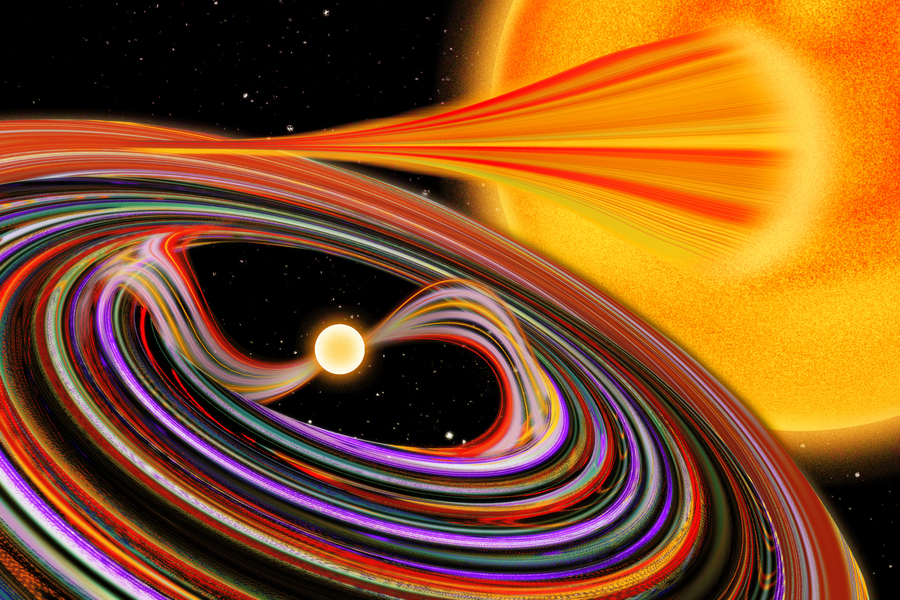
- A pulsar is a type of neutron star with a strong magnetic field that spins incredibly fast. The pulsar at the center of the Lighthouse Nebula is rotating 16 times per second.
- Neutron stars are the leftover cores of massive stars, formed at the end of their life cycles, that possess more mass than the Sun. They are condensed down to the size of a city, making them natural laboratories for studying extreme physics.
- Polarization is a property of light that describes the direction of its electric field vibrations. The polarization degree is a measurement of how aligned those vibrations are with each other.
In June 2025, IXPE spent nearly 18 days focused on the Lighthouse Nebula.
Astronomers studied two narrow X-ray offshoots extending from the pulsar to better understand how electrons at nearly the speed of light interact with this energetic system. The longer offshoot is known as the “filament,” and the shorter one is the “trail.”
When high-energy particles from the pulsar collide with the gas of interstellar space, they form a bow shock, like the bow wave formed at the front of a speeding boat. Most particles become trapped behind this bow shock, forming the turbulent trail behind the pulsar.
Researchers have suspected since 2008 that the highest-energy particles escape through this bow shock into interstellar space, flowing along the galaxy’s magnetic field lines to create the nebula’s long, thin filament.
“We wanted to test that theory,” said Jack Dinsmore, undergraduate student at Stanford University, who led the study. “The ‘smoking gun’ would come by measuring the polarization of the light, which indicates the magnetic field direction. If the magnetic field points along the filament, that confirms that the filament’s particles are flowing along the field.”
One challenge with these measurements is that the Lighthouse Nebula is relatively faint. To address this, IXPE scientists developed advanced analysis methods that use every bit of data, avoiding simplifying steps that could limit information. With these new tools and the new observations of the Lighthouse, the science team successfully measured the filament’s polarization. These techniques also gave a polarization measurement of the trail, and the pulsar’s emission signal.
Their analysis confirmed with more than 99% confidence that the magnetic field does indeed align with the particles’ flow.
While the parallel direction confirms models for the particle’s motion, the polarization degree was high enough to raise new questions.
“Many of the models for filaments assume strong magnetic turbulence,” said Roger Romani, a Stanford University professor who co-authored this paper. “The high polarization degree we measured indicates lower turbulence than such models require.”
The IXPE observations also showed that the magnetic field responsible for X-ray emission had to be parallel to the trail. However, the authors collected radio frequency observations showing a magnetic field pointing almost exactly perpendicular.
“The striking divergence in magnetic field orientations observed between radio and X-ray wavelengths provides compelling evidence for the highly structured nature of these objects,” said Niccolò Bucciantini of the Italian National Institute for Astrophysics and co-author of the study. “This marks the first clear indication that particles of different energies occupy distinct regions within the system, hinting at the presence of multiple, and potentially very different, acceleration mechanisms at work.”
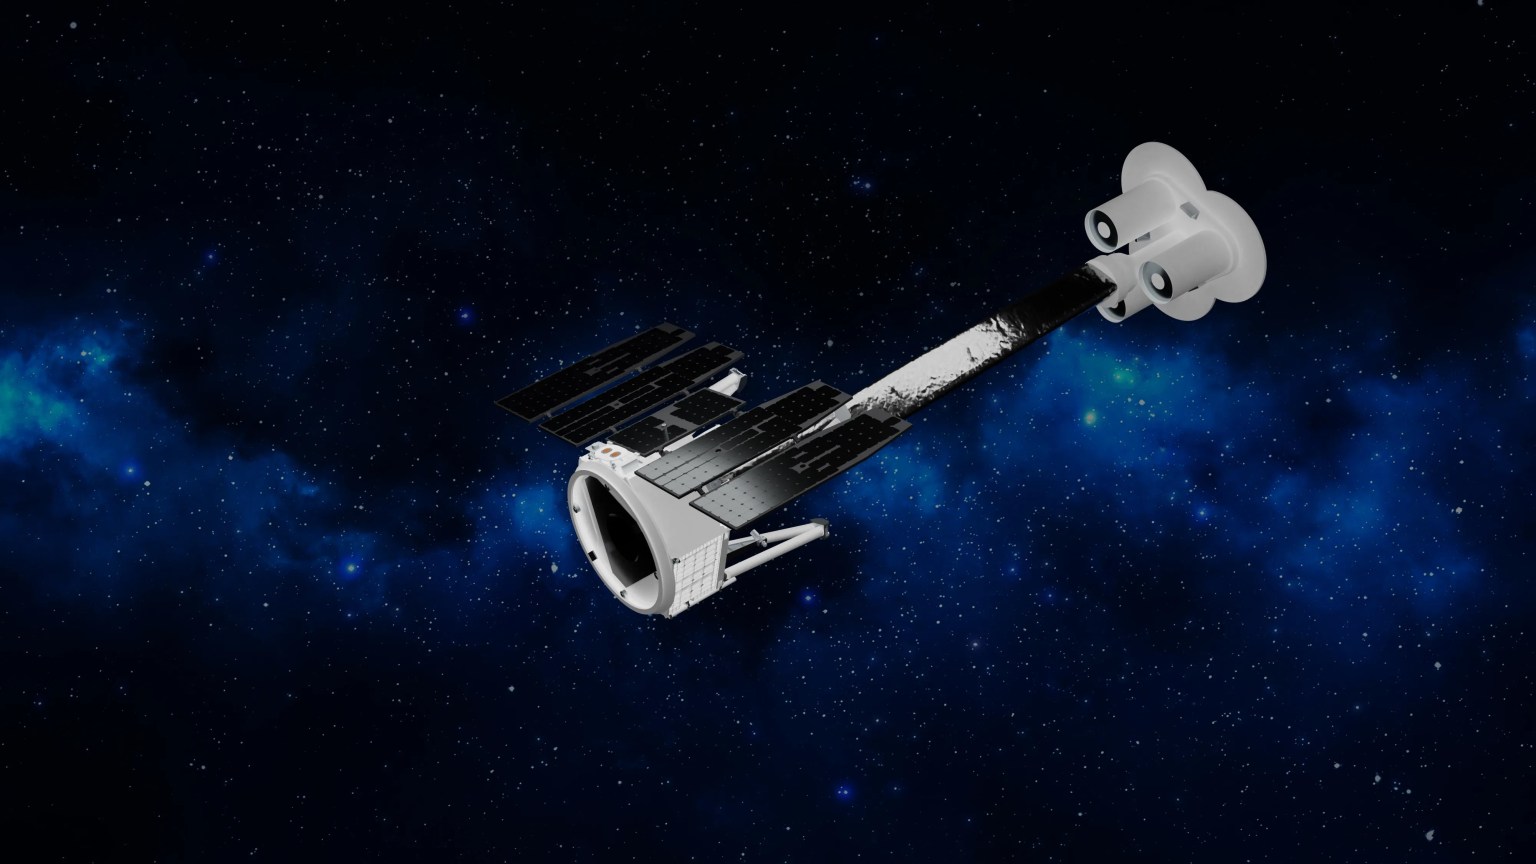
More about IXPE
The IXPE mission, which continues to provide unprecedented data enabling groundbreaking discoveries about celestial objects across the universe, is a joint NASA and Italian Space Agency mission with partners and science collaborators in 12 countries. It is led by NASA’s Marshall Space Flight Center in Huntsville, Alabama, and BAE Systems, Inc. manages spacecraft operations together with the University of Colorado’s Laboratory for Atmospheric and Space Physics in Boulder.
Learn more about IXPE’s ongoing mission here:
About the Author
Michael Allen
Share
Details
Related Terms
Explore More


Principal Investigator and Quality Assessment Reports Evaluate Umbra Synthetic Aperture Radar Data
2026-07-09 18:14
Two new reports from NASA’s Commercial Satellite Data Acquisition (CSDA) program evaluate data from the Umbra X-band Synthetic Aperture Radar (SAR) satellite constellation for the NASA Earth science research and applications community. The results of these evaluations help to inform NASA program management and the user community about the quality of these commercial data for use in NASA science.
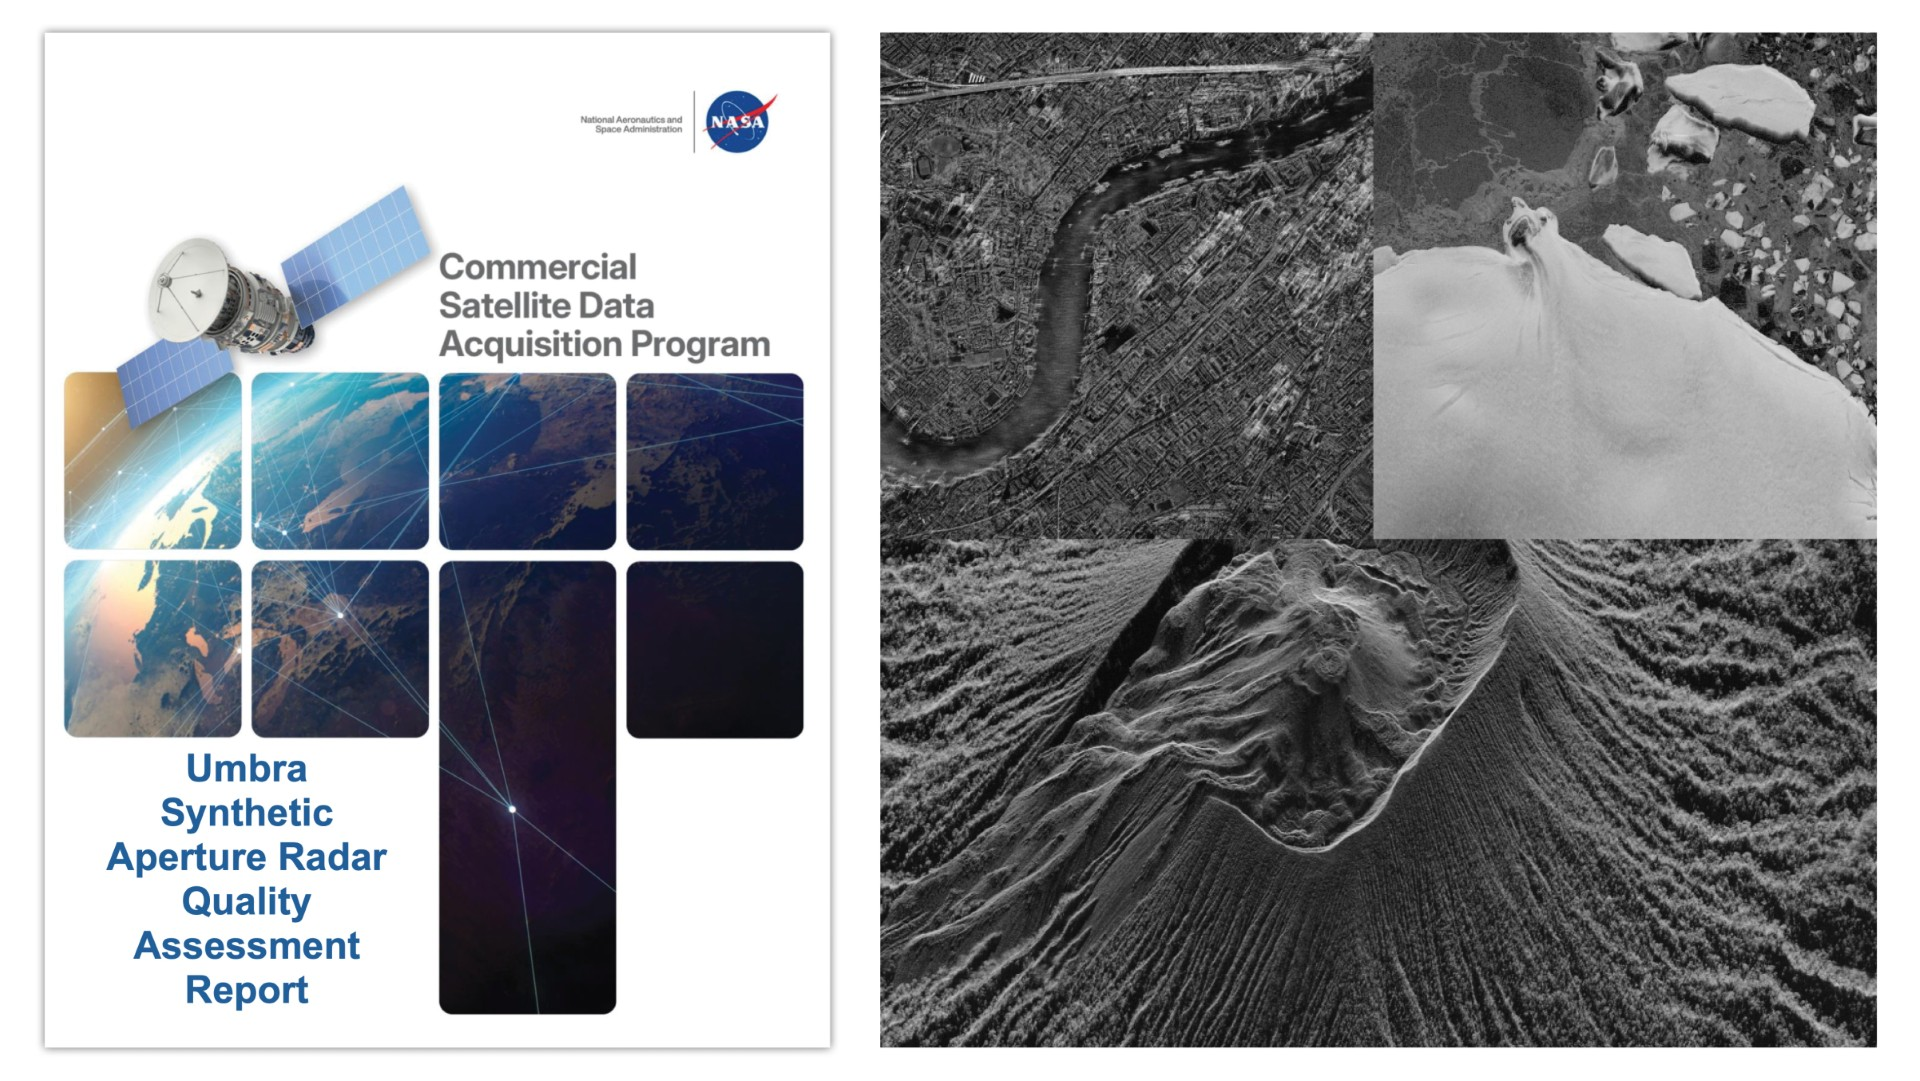
The CSDA Umbra Synthetic Aperture Radar Umbra SAR Principal Investigator Evaluation Summary documents the findings of evaluation teams. The teams were given access to the Umbra archive as well as the ability to task the Umbra constellation for new acquisitions. The tasking capability allowed evaluation teams to test the utility of Umbra data in time-sensitive workflows and to monitor areas experiencing rapid change and/or emergent environmental conditions, such as harmful algal blooms.
Although the Principal Investigator Evaluation Summary supports the use of Umbra SAR data for NASA Earth science research and applications overall, it noted several strengths and weaknesses of the Umbra X-band data. Strengths included access to a very high spatial resolution X-band SAR satellite constellation; taskable access to high temporal repeat opportunities with quick turnaround; imaging flexibility with a range of azimuth and incidence angles; and the company’s Open Data Program. Conversely, the PI teams reported weaknesses, including issues with Umbra geolocation (noting large and small geolocation errors), limited software compatibility, metadata, and some missing technical documentation.
Additionally, the CSDA Umbra Synthetic Aperture Radar Umbra SAR Quality Assessment Report documents the results of radiometric and geometric analyses performed by NASA subject matter experts (SMEs) enlisted to evaluate the fundamental quality of the Umbra data following the Joint NASA/European Space Agency (ESA) assessment guidelines (ESA-NASA, 2024).
Performed mainly on the single-look complex (SLC) Level 1 data products in Sensor Independent Complex Data (SICD) format, along with some additional Level 2 products used in science usability assessments by the evaluation team, the CSDA SMEs found the spatial resolution of the data agreed with Umbra’s specifications. However, the quality analysis results for geolocation accuracy did not universally align with the company’s specifications. Given these results, the SME’s concluded that “the overall positioning performance of the Umbra data did not meet the expected accuracy.
Regarding the radiometric performance of the data, which was assessed in terms of absolute accuracy, stability, and sensitivity, the SMEs found the data “underperform[ed] relative to that of well-calibrated reference SAR systems.”
About the CSDA Program
The CSDA program was established to identify, evaluate, and acquire data from commercial sources that support the NASA Earth science research and application goals. NASA’s Earth Science Division recognizes the potential impact commercial satellite constellations may have in encouraging/enabling efficient approaches to advancing Earth System Science and applications development for societal benefit. Commercially acquired data may also provide a cost-effective means to augment and/or complement the suite of Earth observations acquired by NASA, other U.S. government agencies, and international partners.
To read the reports in full, see the links under “Evaluation” heading on the CSDA’s Umbra commercial vendor webpage.
TechCrunch - Latest
Dumb Co dared me to trade my iPhone for a hacked flip phone
2026-07-10 16:06
Oratomic raises $300M to build a viable quantum computer that needs only 20K qubits
2026-07-10 15:00
Netflix could be planning ‘always-on’ live TV channels
2026-07-10 14:53
EU threatens Meta with fines over addictive features on Facebook and Instagram
2026-07-10 14:19
Florida ransomware negotiator convicted for helping ransomware gang extort US companies
2026-07-10 14:11