📰 Trending Topics
Google News - Trending
Google News - Technology
Hinge damage suspected to be behind iPhone Duo screen cracks - AppleInsider
2026-10-25 21:28
- Hinge damage suspected to be behind iPhone Duo screen cracks AppleInsider
- A YouTuber dissected an iPhone Duo and thinks he found the cause of crackgate The Verge
- YouTubers break the iPhone Duo, but stores aren't seeing broken displays AppleInsider
- iFixit iPhone Duo Teardown Points to Possible Cause of Screen Cracks MacRumors
- iPhone Duo Owners Report Devices Breaking Worldwide as Fears Grow Over Critical Design Flaw Gadget Review
'Call of Duty' North Korea invasion edition tops sales charts in South - Japan Today
2026-10-25 21:00
- 'Call of Duty' North Korea invasion edition tops sales charts in South Japan Today
- Call of Duty: Modern Warfare 4 Launch Patch Notes Call of Duty® | Best-Selling Video Game Franchise
- Call of Duty: Modern Warfare 4 – Kill Block is Must-Play Multiplayer at Launch XBOX Wire
- Call of Duty: Modern Warfare 4 review – a thrilling airport novel of a game The Guardian
- The ‘Call Of Duty: Modern Warfare 4’ Metacritic Review Score Is The Best In 15 Years Forbes
The iPhone Duo Likes & Dislikes After 4 Days Of Real World Use - Forbes
2026-10-25 08:30
- The iPhone Duo Likes & Dislikes After 4 Days Of Real World Use Forbes
- Review of iPhone Duo: A New Chapter That Redefines a Smartphone’s Purpose The New York Times
- The truth about iPhone Duo problems: The shoddy-looking apps, FaceTime camera, and the hinge Mashable
- A Tale of Two iPhones Spyglass
- Apple seeks more iPhone Duo supplies amid strong demand for debut foldable- report Investing.com
"Tomb Raider: Legacy of Atlantis" 30th Anniversary Trailer - Dark Horizons
2026-10-25 23:48
- "Tomb Raider: Legacy of Atlantis" 30th Anniversary Trailer Dark Horizons
- Tomb Raider: Legacy of Atlantis – the evolution of Lara Croft’s design PlayStation.Blog
- Tomb Raider's 2027's Return Looks Stunning in New Official Footage Polygon.com
- TOMB RAIDER MARKS 30TH ANNIVERSARY WITH MUSIC RELEASES AND ARTWORK TombRaiderChronicles
- Tomb Raider: Legacy of Atlantis Length Around 14-16 Hours; Devs Said They’ve “Intentionally” Built a World That’ll Make Players “Curious to Explore” MP1st
NASA - Breaking News
2026 October 26 – M42: The Great Nebula in Orion
2026-10-26 04:05
APOD
Astronomy Picture of the Day
Discover the cosmos! Each day a different image or photograph of our fascinating universe is featured, along with a brief explanation written by a professional astronomer.

M42: The Great Nebula in Orion
Explanation: The Great Nebula in Orion, an immense, nearby starbirth region, is one the most famous of all astronomical nebulas. Here, glowing gas surrounds hot young stars at the edge of an immense interstellar molecular cloud only 1500 light-years away. In the featured deep image in assigned colors highlighted by emission in hydrogen, wisps and sheets of dust and gas are particularly evident. The Great Nebula in Orion can be found with the unaided eye near the easily identifiable belt of three stars in the popular constellation Orion. In addition to housing a bright open cluster of stars known as the Trapezium, the Orion Nebula contains many stellar nurseries. These nurseries contain much hydrogen gas, hot young stars, proplyds, and stellar jets spewing material at high speeds. Also known as M42, the Orion Nebula spans about 40 light years and is located in the same spiral arm of our Galaxy as the Sun.
Tomorrow’s picture: open space
| Date: | October 26, 2026 |
|---|---|
| Credit & Copyright: | Roberto Palaia |
| Authors & editors: | Robert Nemiroff, Jerry Bonnell, Cecilia Chirenti, Keighley Rockcliffe |
| A service of: |
ASD at NASA / GSFC, NASA Science Activation & Michigan Tech. U. |
Hunting Red Leaves with Satellites
2026-10-26 04:01




September 29 to October 4
October 5 to 11
The Japanese tradition of momijigari, or “red leaf hunting,” stretches back more than a millennium, as evidenced by ancient poems describing journeys to admire fall foliage. In America, mentions of foliage trips began appearing in the historical record in the 19th century, around the time artists and poets such as Frederic Church and Emily Dickinson celebrated autumn color in depictions of the Northeast.
Modern-day leaf peepers have a new way to track and savor the seasonal phenomenon. The hyperspectral OCI (Ocean Color Instrument) on NASA’s PACE (Plankton, Aerosol, Cloud, ocean Ecosystem) satellite observes the planet’s oceans and vegetation daily at 286 spectral bands. Among this array are a few groups of wavelengths that allow scientists to track subtle changes in leaf pigments key to fall foliage displays, including anthocyanins (reds), carotenoids (yellows and oranges), and chlorophylls (greens).
NASA scientists can track fall color by measuring how much red, orange, and yellow forests show compared with green. Tracking the ratio over time reveals where leaves are changing and when color peaks. The maps above show vegetation “redness” from September 29 to October 4 (left) and October 5 to 11 (right). Areas shown in green have values near 1, meaning the satellite detects about as much red as green, and most leaves have not yet turned. Areas shown in light yellow and red have higher values, indicating progressively more red pigment relative to green.
The satellite detected particularly high levels of redness in parts of northern and eastern Russia, northern Alaska, and northern Canada from September 29 to October 4. In New England and upstate New York, redness began to fade during the week of October 5 to 11, even as it spread across much of the Midwest and the Mid-Atlantic. (Not all the yellows and reds on the maps represent fall colors. Crops in some agricultural areas, for instance, show high anthocyanin levels as they age and after they are harvested. Also, in some regions, clouds produce what appear to be gaps in the vegetation.)
Seeing Red in Vermont
Many of the reddest areas—such as the Adirondacks in New York, the Green Mountains in Vermont, and the White Mountains in New Hampshire—have large numbers of sugar maples (Acer saccharum) and red maples (Acer rubrum), deciduous trees that turn a brilliant shade of crimson in the fall. Blueberries, bilberries, sedges, mosses, and grasses likely contribute to the intense reds detected in marshy tundra areas in northern Alaska, Canada, and Russia.

The OLI (Operational Land Imager) on Landsat 9 captured an image (above) of intensely red foliage around Ripton, Vermont, on October 3, 2026, around the peak of redness in the region. Poet Robert Frost, author of “October,” “The Road Not Taken,” “Nothing Gold Can Stay,” and several other poems that evoke fall foliage, kept a summer home and farm in Ripton and taught at Middlebury’s Bread Loaf School of English.
Some other satellites with hyperspectral sensors can measure fall foliage pigments in a way that is similar to PACE, but only in more localized areas and less frequently. PACE is the first satellite capable of measuring all three key leaf pigments—anthocyanins, carotenoids, and chlorophylls—across the entire planet every day or two.
“It’s the ability to collect time-series data of anthocyanins and carotenoids everywhere on Earth repeatedly that is game-changing,” said Karl Huemmrich, a vegetation scientist with the Goddard Earth Sciences Technology and Research II center at the University of Maryland, Baltimore County. Huemmrich, who is also a member of the PACE science team, was eager to work with the satellite because of OCI’s broad swath and short revisit time. “The time-series data allow us to determine peak redness and yellowness anywhere on Earth,” he said.
In the fall, leaves change colors as they lose chlorophyll, a green molecule that plants use to synthesize food. Since chlorophyll is not a stable compound, plants must continuously synthesize it, a process that requires ample sunlight and warm temperatures. As temperatures decrease and days shorten in autumn, levels of chlorophyll drop, causing greens to fade and presenting an opportunity for carotenoids and anthocyanins to show their colors.
Observing Leaves in a Canopy Near You
As part of the ongoing North American Phenology Campaign run by the Global Learning and Observations to Benefit the Environment (GLOBE) program, NASA data scientist Skye Caplan has been posting weekly foliage maps of vegetation redness. The maps show waves of red emerging in the high latitudes in August and shifting equatorward in September and October. The PACE team is asking the public to submit photos of fall foliage to help scientists “ground truth” the satellite observations and better understand how various factors influence vegetation color.

“Changes in pigments can also occur when vegetation is stressed due to drought or insect damage,” said Caplan. She noted that changes like these likely help explain why PACE measures high levels of redness in agricultural regions of Brazil, Australia, and Canada that don’t track closely with broader seasonal changes.
“The more photos we can get from the ground, the better,” Caplan said. Ground photos help scientists refine PACE’s observations of vegetation color, which the team hopes will eventually support several lines of research. These include how the timing of spring greening and fall senescence is changing, how vegetation changes affect the global carbon cycle, and how leaf color influences wildfire risk. Scientists also want to know whether PACE can detect early warning signs of drought, insect infestations, and plant disease.
People can participate in the GLOBE campaign even if they live in an area without dense forests or picturesque fall foliage displays. Scientists also want ground observations of shrubs, grasses, wildflowers, evergreens, crops, and other vegetation. But when it comes to “red leaf hunting,” don’t delay, Caplan said. “Color changes happen kind of slowly, then all at once, and then they’re gone.”
NASA Earth Observatory images by Lauren Dauphin, using PACE data courtesy of Skye Caplan/NASA’s Goddard Space Flight Center and Landsat data from the U.S. Geological Survey. Photo courtesy of the GLOBE Program. Story by Adam Voiland.


References & Resources
- Caplan, S. & Huemmrich, F. (2025) Unveiling PACE OCI’s hyperspectral terrestrial data products. Remote Sensing Letters, 16(4), 422-433.
- GLOBE Program (2026, October 18) PACE Fall Foliage Updates. Accessed October 22, 2026.
- GLOBE Program (2026) North America Phenology Campaign. Accessed October 22, 2026.
- GLOBE Program (2026, September 22) Tracking Fall Color with PACE. Accessed October 22, 2026.
- Huemmrich, K. et al. (2026) Observing fall foliage with PACE pigment indices. Remote Sensing Letters, 17(6), 853-863.
- Mental Floss (2024, August 20) A Brief History of Leaf-Peeping. Accessed October 22, 2026.
- NASA Scientific Visualization Studio (2025) Global Views of PACE Land Vegetation Data. Accessed October 22, 2026.
- UMBC (2026, June 12) For the leaf peepers: How NASA’s PACE is improving fall color forecast. Accessed October 22, 2026.
- Veltra (2025) Autumn in Japan: The Cultural Meaning of Kōyō (紅葉) & Momijigari. Accessed October 22, 2026.
You may also be interested in:
Stay up-to-date with the latest content from NASA as we explore the universe and discover more about our home planet.

Reds, yellows, and oranges are already sweeping across tundra landscapes in Nunavut.

Fall color covers the forested slopes of Bieszczady National Park, while patches of polonina, a type of high-mountain meadow, have…

Orange streams are now being spotted in hundreds of watersheds in permafrost areas throughout Alaska’s Brooks Range.




APOD: 2026 October 25 – Dark Matter in a Simulated Universe
2026-10-25 08:19
APOD
Astronomy Picture of the Day
Discover the cosmos! Each day a different image or photograph of our fascinating universe is featured, along with a brief explanation written by a professional astronomer.

Dark Matter in a Simulated Universe
Explanation: Is our universe haunted? It might look that way on this dark matter map. The gravity of unseen dark matter is the leading explanation for why galaxies rotate so fast, why galaxies orbit clusters so fast, why gravitational lenses so strongly deflect light, and how visible matter is distributed. The featured image from the American Museum of Natural History‘s Hayden Planetarium Space Show, Dark Universe, highlights one example of how pervasive dark matter might haunt our universe. In this frame from a detailed computer simulation, complex filaments of dark matter, shown in black, are strewn about the universe like spider webs, while the relatively rare clumps of familiar baryonic matter are colored orange. These simulations are good statistical matches to astronomical observations. In what is perhaps a scarier turn of events, dark matter — although quite strange and in an unknown form — is no longer thought to be the strangest source of gravity in the universe. That honor now falls to dark energy, a more uniform source of repulsive gravity that seems to now dominate the expansion of the entire universe.
Tomorrow’s picture: Orion the Great
| Date: | October 25, 2026 |
|---|---|
| Credit & Copyright: | Tom Abel & Ralf Kaehler (KIPAC , SLAC), AMNH |
| Authors & editors: | Robert Nemiroff, Jerry Bonnell, Cecilia Chirenti, Keighley Rockcliffe |
| A service of: |
ASD at NASA / GSFC, NASA Science Activation & Michigan Tech. U. |
APOD: 2026 October 24 – Rosetta’s Selfie
2026-10-24 04:05
APOD
Astronomy Picture of the Day
Discover the cosmos! Each day a different image or photograph of our fascinating universe is featured, along with a brief explanation written by a professional astronomer.

Rosetta’s Selfie
Explanation: This Rosetta spacecraft selfie was snapped on October 7th, 2014. At the time the comet-chasing spacecraft was about 472 million kilometers from planet Earth, but only 16 kilometers from the surface of comet 67P/Churyumov-Gerasimenko. Looming beyond the spacecraft near the top of the frame, dust and gas stream away from the comet’s curious double-lobed nucleus. Bright sunlight glints off one of Rosetta’s 14 meter long solar arrays. In fact, two exposures, one short and one long, were combined to record the dramatic high contrast scene using the CIVA camera system on Rosetta’s still-attached Philae lander. Its chosen primary landing site was on the visible hemisphere of the smaller lobe of the nucleus. This was the last image from Philae’s camera before the lander separated from Rosetta on November 12. Shortly after separation Philae took another image looking back toward the orbiter and began its descent to the nucleus of the comet.
Tomorrow’s picture: dark matters
| Date | October 24, 2026 |
|---|---|
| Credit: | ESA/Rosetta/Philae/CIVA |
| Authors & editors: | Jerry Bonnell, Cecilia Chirenti, Robert Nemiroff, Keighley Rockcliffe |
| A service of: |
ASD at NASA / GSFC, NASA Science Activation & Michigan Tech. U. |
NASA, Partners Accelerate Lander Development for 2028 Moon Missions
2026-10-23 22:39
NASA, Partners Accelerate Lander Development for 2028 Moon Missions
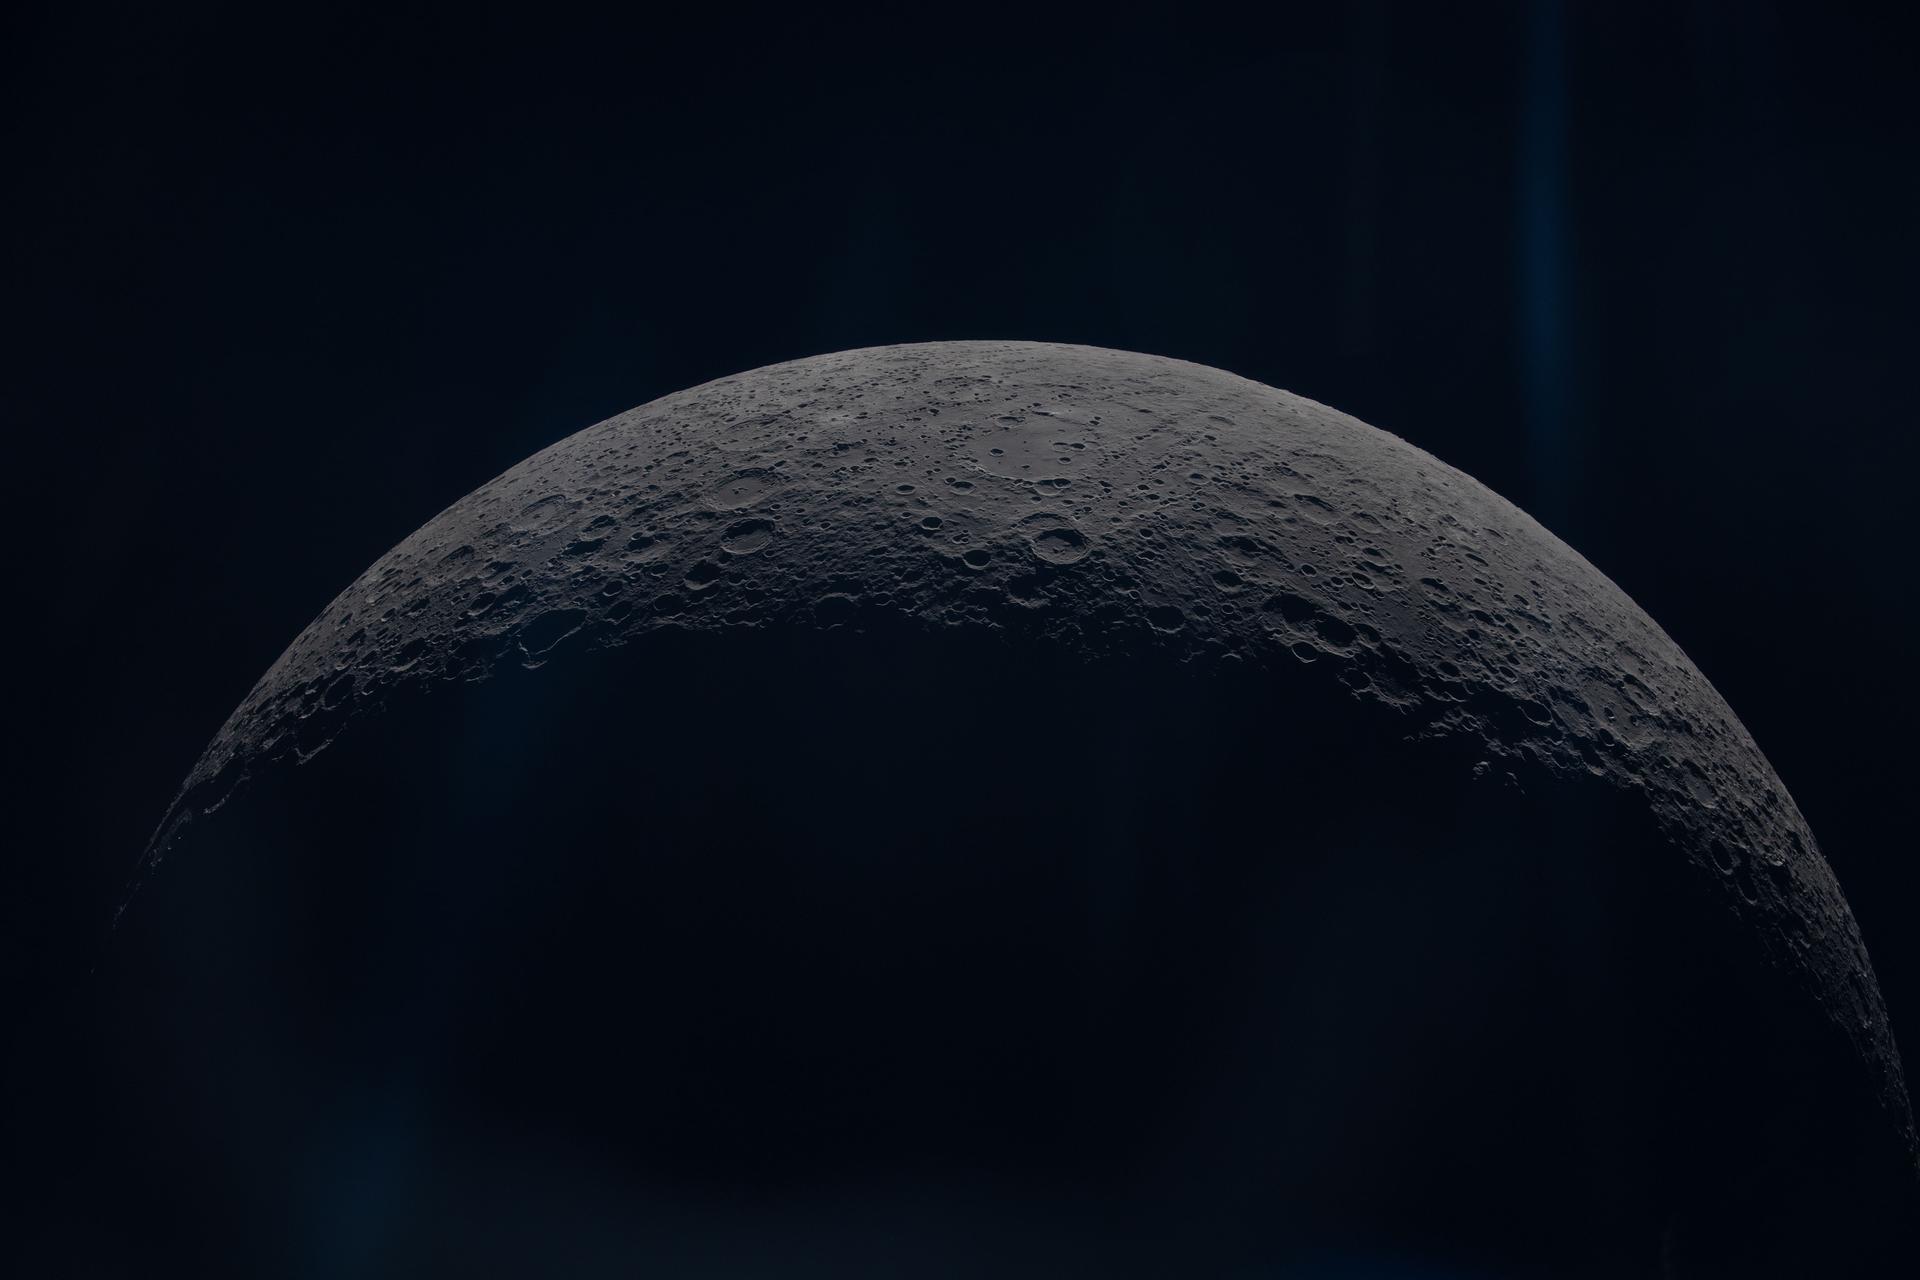
As NASA returns humans to the lunar surface and establishes a long-term presence on our closest celestial neighbor, the agency and commercial human landing system providers Blue Origin and SpaceX have streamlined the designs and changed both concepts of operations for its future crewed landers.
Since NASA established initial contracts with Blue Origin and SpaceX for crewed missions to the Moon, the agency has redefined Artemis III to demonstrate rendezvous and docking capabilities between test versions of landers from each provider and the agency’s Orion spacecraft in low Earth orbit next year. In parallel, the companies are also developing crew and cargo versions of their landers for near-term Artemis missions.
“We are executing President Trump’s National Space Policy to complete the long-awaited return of American astronauts to the lunar surface in 2028 and establish a Moon Base,” said NASA Administrator Jared Isaacman. “We have a proven foundation in SLS and Orion, along with two lunar landers in development with Blue Origin and SpaceX. But NASA has no intention of sitting idly by as all the pieces come together. That is not how Apollo succeeded, and it is not how the near-impossible is achieved. NASA is energized, our core capabilities are being rebuilt, our machine shops are running 24/7, and our experts are in the field attacking the critical path. We are building a Super Bowl-caliber team to safely achieve these objectives and everything that comes next.”
NASA is energized, our core capabilities are being rebuilt, our machine shops are running 24/7, and our experts are in the field attacking the critical path. We are building a Super Bowl-caliber team to safely achieve these objectives and everything that comes next.

Jared Isaacman
NASA Administrator
For the initial crewed missions to the Moon, Artemis astronauts will launch in the agency’s Orion spacecraft on top of the SLS (Space Launch System) rocket from NASA’s Kennedy Space Center in Florida. During each Artemis mission, a commercial human landings system will link up with Orion before taking two crew members to the lunar surface while two remain aboard Orion. To accelerate development toward a 2028 landing, the Artemis landers and Orion will no longer rendezvous in a near-rectilinear halo orbit around the Moon and instead meet up in an orbit that differs for each partner, informed by their systems.
Both companies are required to perform an uncrewed demonstration mission with their crewed landers prior to the near-term Artemis crewed missions to the Moon. NASA will certify lander systems prior to the crewed missions to ensure safety and mission success.
Starship lander concept of operations

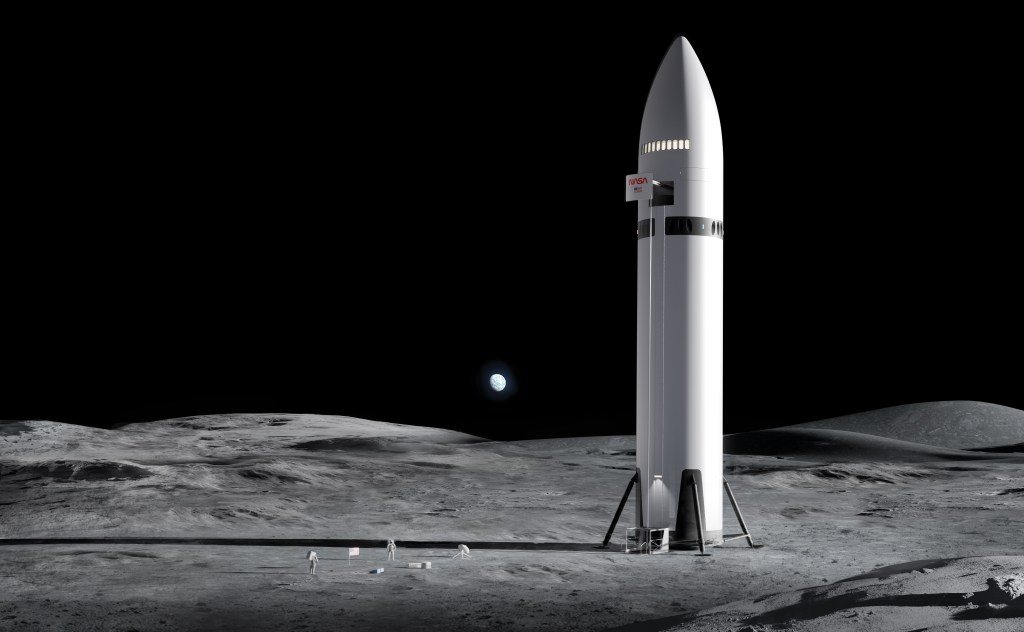
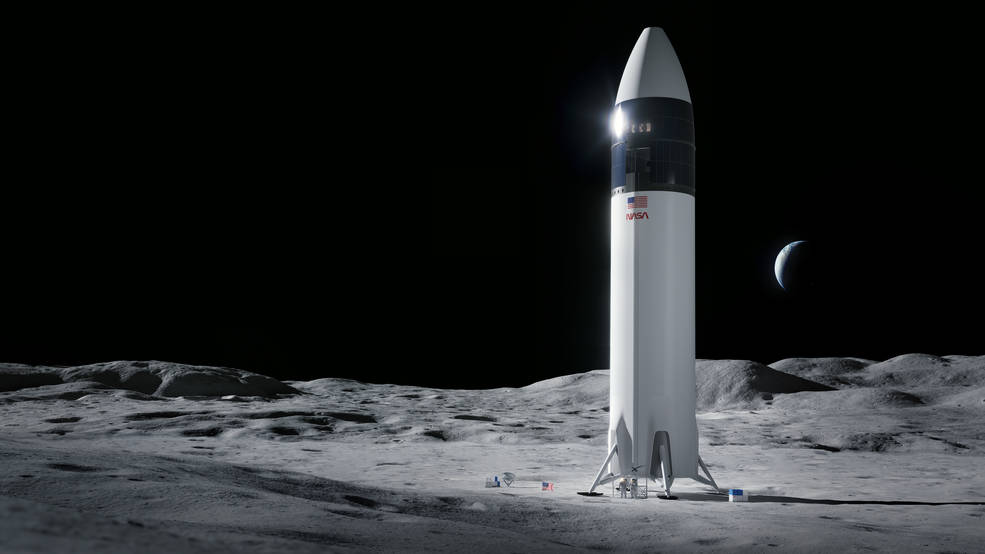
SpaceX continues to plan for an in-space propellant aggregation approach to transfer super cold, or cryogenic, liquid propellant in space. The company will launch multiple versions of Starship to low Earth orbit prior to the launch of the Starship Human Landing System (HLS) from Florida. Similar to a gas station on Earth, the series of propellant “tanker” Starships in low Earth orbit will transfer propellant to the waiting “depot” Starship. The depot Starship will ultimately fuel the Starship lander for its journey to the Moon.
Under the revised operations, Starship HLS will await Orion and its crew in Earth orbit. The lander and Orion will rendezvous and dock in Earth orbit, then the Starship lander will perform a trans-lunar injection burn to send the combined lander and Orion stack to low lunar orbit. NASA is working to modify Orion to enable Starship to push it to the Moon. The lander will bring two crew members to the lunar surface for several days before delivering them back to Orion for the ride back to Earth.
Propellant aggregation in low Earth orbit allows for flexibility in the crew launch timing on SLS, while a trans-lunar injection burn performed by the Starship lander will enable direct access to low lunar orbit. This new concept of operations using low lunar orbit will significantly lower the amount of propellant Starship needs to aggregate in space while reducing the amount of time it can take for astronauts leaving the Moon’s surface in Starship to link back up with Orion. SpaceX will demonstrate the propellant aggregation approach during the uncrewed demonstration mission.
Blue Moon lander concept of operations
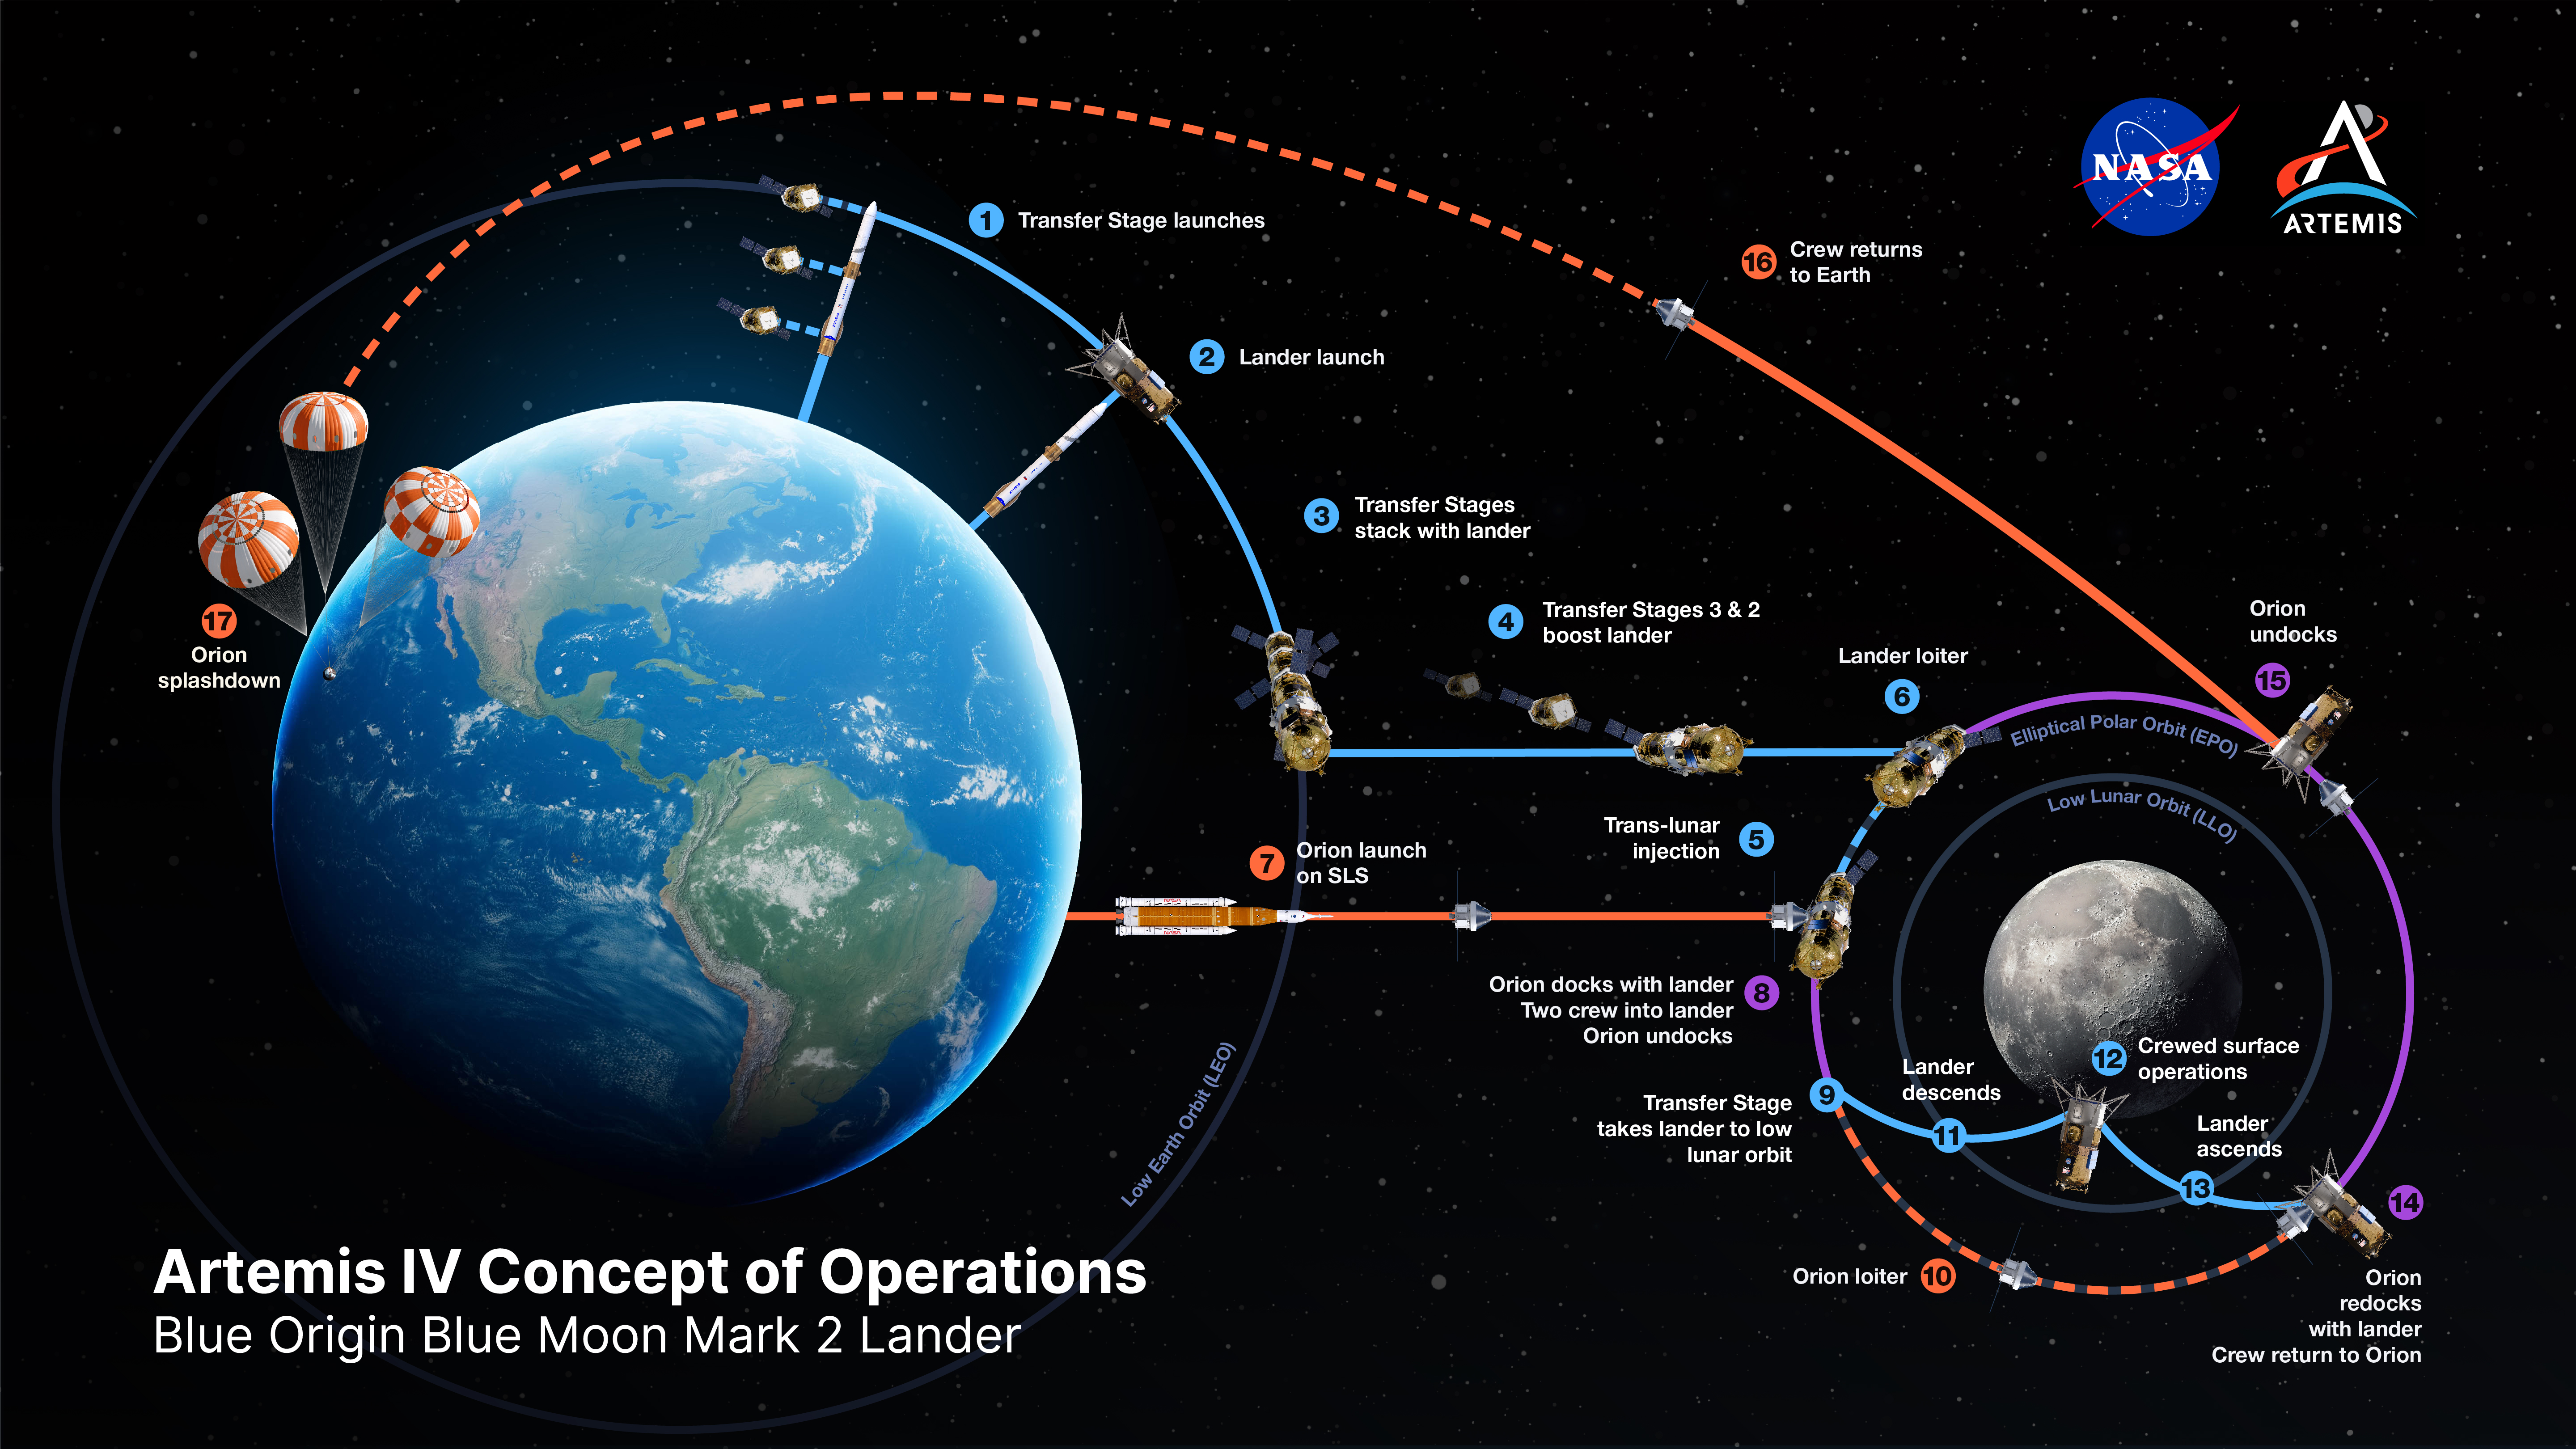
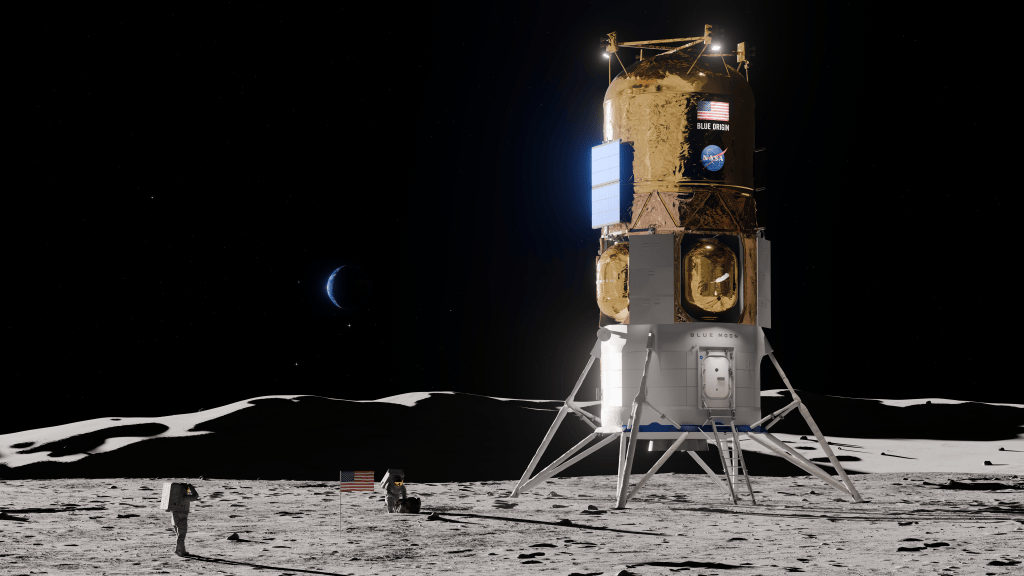
For its accelerated 2028 crewed lunar landing mission, Blue Origin will defer propellant transfer and use three transfer stages to send the Blue Moon Mark 2 Alpha Lander to the Moon. Based on existing Mark 1 and Mark 2 hardware, the stages operate like a multistage rocket. They launch into low Earth orbit, followed by the Mark 2 lander. Once docked, the stack departs for an elliptical polar orbit around the Moon, with each transfer stage separating as its propellant depletes. Compared with the previously planned near-rectilinear halo orbit, the elliptical polar orbit offers faster returns from the lunar surface to Orion, reduces Blue Moon lander propellant requirements, and maximizes the performance available by SLS.
This architecture provides multiple opportunities for SLS and Orion to launch the crew to elliptical polar orbit and dock with the Blue Moon Mark 2 lander. Two crew members then transfer to the lander and descend to the Moon’s South Pole. After surface operations, the lander returns to Orion, where the crew transfers for their journey back to Earth.
Blue Origin will incorporate lessons from earlier robotic Mark 1 missions supporting the agency’s Moon Base Program and demonstrate the full mission profile in an uncrewed lander transfer stage demonstration mission.


Returning American astronauts to the Moon
Ultimately, based on lander readiness, NASA will determine which company will be first selected to safely deliver astronauts to the Moon’s surface and back to lunar orbit in 2028. A second crewed landing opportunity will follow.
NASA is targeting two, approximately two-hour long lunar surface Moonwalks during initial surface missions. Astronauts will use the Moonwalks to collection lunar samples and test capabilities of the spacesuit provided by Axiom Space.
Earlier this year, NASA updated its contracts with Blue Origin and SpaceX for human landing systems and large cargo deliveries to the Moon. The updates align the agency’s human landing system requirements with acceleration efforts announced earlier this year to streamline Artemis mission architecture, expedite a lunar return, and support an increased mission cadence to the Moon.
Under the original HLS contracts, SpaceX’s Starship human landing system was assigned to the Artemis III and IV missions, while Blue Origin would use its Blue Moon Mark 2 human landing system for Artemis V. Under the contract realignments, both providers are participating in the Artemis III mission in low Earth orbit and neither lander provider has been assigned to a specific Artemis lunar landing mission.
“NASA and our lunar lander providers Blue Origin and SpaceX have been working hand in hand to ensure we can return American astronauts to the Moon by 2028,” said Jeremy Parsons, NASA’s Artemis program manager.“While work to realign with our partners in support of architecture updates announced at Ignition Day in March has been underway since then, updating the contracts ensures NASA and its partners are on the same page with requirements and other milestones to ensure continued insight into lander development to support mission success and the safety of our Moon crews.”
Both Blue Origin and SpaceX have added development milestones to provide NASA with more insight into lander development efforts, reducing risk and enhancing astronaut safety in preparation for crewed Moon landings. SpaceX is adding two demonstrations of its crew cabin, called Cabin 1, for its Starship lander. Blue Origin is adding new human-in-the-loop testing and hardware readiness milestones to streamline training development as well as ground and flight operations.
As part of a Golden Age of innovation and exploration, NASA will send Artemis astronauts on increasingly difficult missions near the lunar South Pole to explore more of the Moon than ever before. In addition to providing economic benefits and advancing scientific discovery though its Moon missions, NASA will establish an enduring human presence on the lunar surface and build on the agency’s foundation for the first crewed mission to Mars.
About the Author
Corinne Beckinger
Share
Details
Related Terms
Explore More




TechCrunch - Latest
The best apps for tracking your reading and discovering new books
2026-10-26 01:10
Grok releases the first seven minutes of its AI-generated ‘Odyssey’
2026-10-25 21:31
‘Cyberselfish’ author takes aim at techno-libertarianism as her book returns from the dead
2026-10-25 20:20
AI delivers ‘zero financial payoff’ to most companies, Apollo economist says
2026-10-25 16:57
TechCrunch Mobility: Blue-green is the color of autonomy
2026-10-25 16:05