📰 Trending Topics
Google News - Trending
Google News - Technology
I’ve Tested Echo Shows and Nest Hubs. Here’s How Apple’s HomeView Display Stacks Up - CNET
2026-10-15 16:00
- I’ve Tested Echo Shows and Nest Hubs. Here’s How Apple’s HomeView Display Stacks Up CNET
- Apple Introduces HomeView, a $299 Tablet for the Home The New York Times
- Apple’s new HomeView is up for preorder at Target for $299.99 - Here’s what we like about it Syracuse.com
- Introducing Apple Home Collection, a new lineup of smart home accessories Apple
- John Ternus Takes Next Big Swing as Apple CEO With HomeView Tablet WSJ
Amazon launches new "personal AI" devices that can listen to your conversations and take notes - CBS News
2026-10-15 15:34
- Amazon launches new "personal AI" devices that can listen to your conversations and take notes CBS News
- Amazon introduces 2 new AI products from Bee: Bee Frontier and Bee Eclipse About Amazon
- Amazon launches new Bee 'personal AI' devices that listen to conversations CNBC
- Amazon Debuts Revamped Bee AI Wearables, $12-a-Month Subscription Plan Bloomberg.com
- Amazon devices chief Panos Panay sees a future where AI devices replace the need to use apps TechCrunch
Microsoft’s new Photos app combines your PC, OneDrive, and iCloud galleries - The Verge
2026-10-15 14:53
- Microsoft’s new Photos app combines your PC, OneDrive, and iCloud galleries The Verge
- What’s new in Windows 11: Everyday experiences, reimagined Windows Blog
- Microsoft Says It Made Windows 11 Zippier, Especially On PCs With Less RAM Engadget
- "A new PC is a meaningful purchase" — Microsoft thinks Windows 11 is finally good enough to be the selling point Windows Central
- Microsoft Confirms 20% Faster Windows 11 Experience, 8 GB Systems Also Run Better TechPowerUp
Alexa Tablet 12 Pro Review: Amazon's Premium Tablet Gets Almost Everything Right - Engadget
2026-10-15 18:30
- Alexa Tablet 12 Pro Review: Amazon's Premium Tablet Gets Almost Everything Right Engadget
- The Alexa Tablet 12 Pro is almost the Android tablet we needed The Verge
- Amazon could have massacred Apple's struggling iPads, but the new Alexa Tablets are not it PhoneArena
- Amazon shuffles Alexa leadership following high-end tablet release Reuters
- Amazon’s $550 tablet breaks its oldest hardware rule TheStreet
Microsoft fixes bug causing Windows black screens, Explorer crashes - BleepingComputer
2026-10-15 09:10
- Microsoft fixes bug causing Windows black screens, Explorer crashes BleepingComputer
- Ready for Windows 11 version 26H2? Here’s how to upgrade, what to expect, and how to avoid common pitfalls Windows Central
- Windows 11 PCs just got better Bluetooth and a remappable Copilot key PCWorld
- Windows 11 KB5127648 breaks WPA 802.1X PEAP Wi‑Fi auth, but there's a manual fix [Update] Neowin
- Windows 11 Remote Desktop Fails After Update — Microsoft Points to Security Feature TechRepublic
NASA - Breaking News
NASA to Help Unlock Mysteries of Mars’ Moons in Upcoming Mission
2026-10-15 19:58
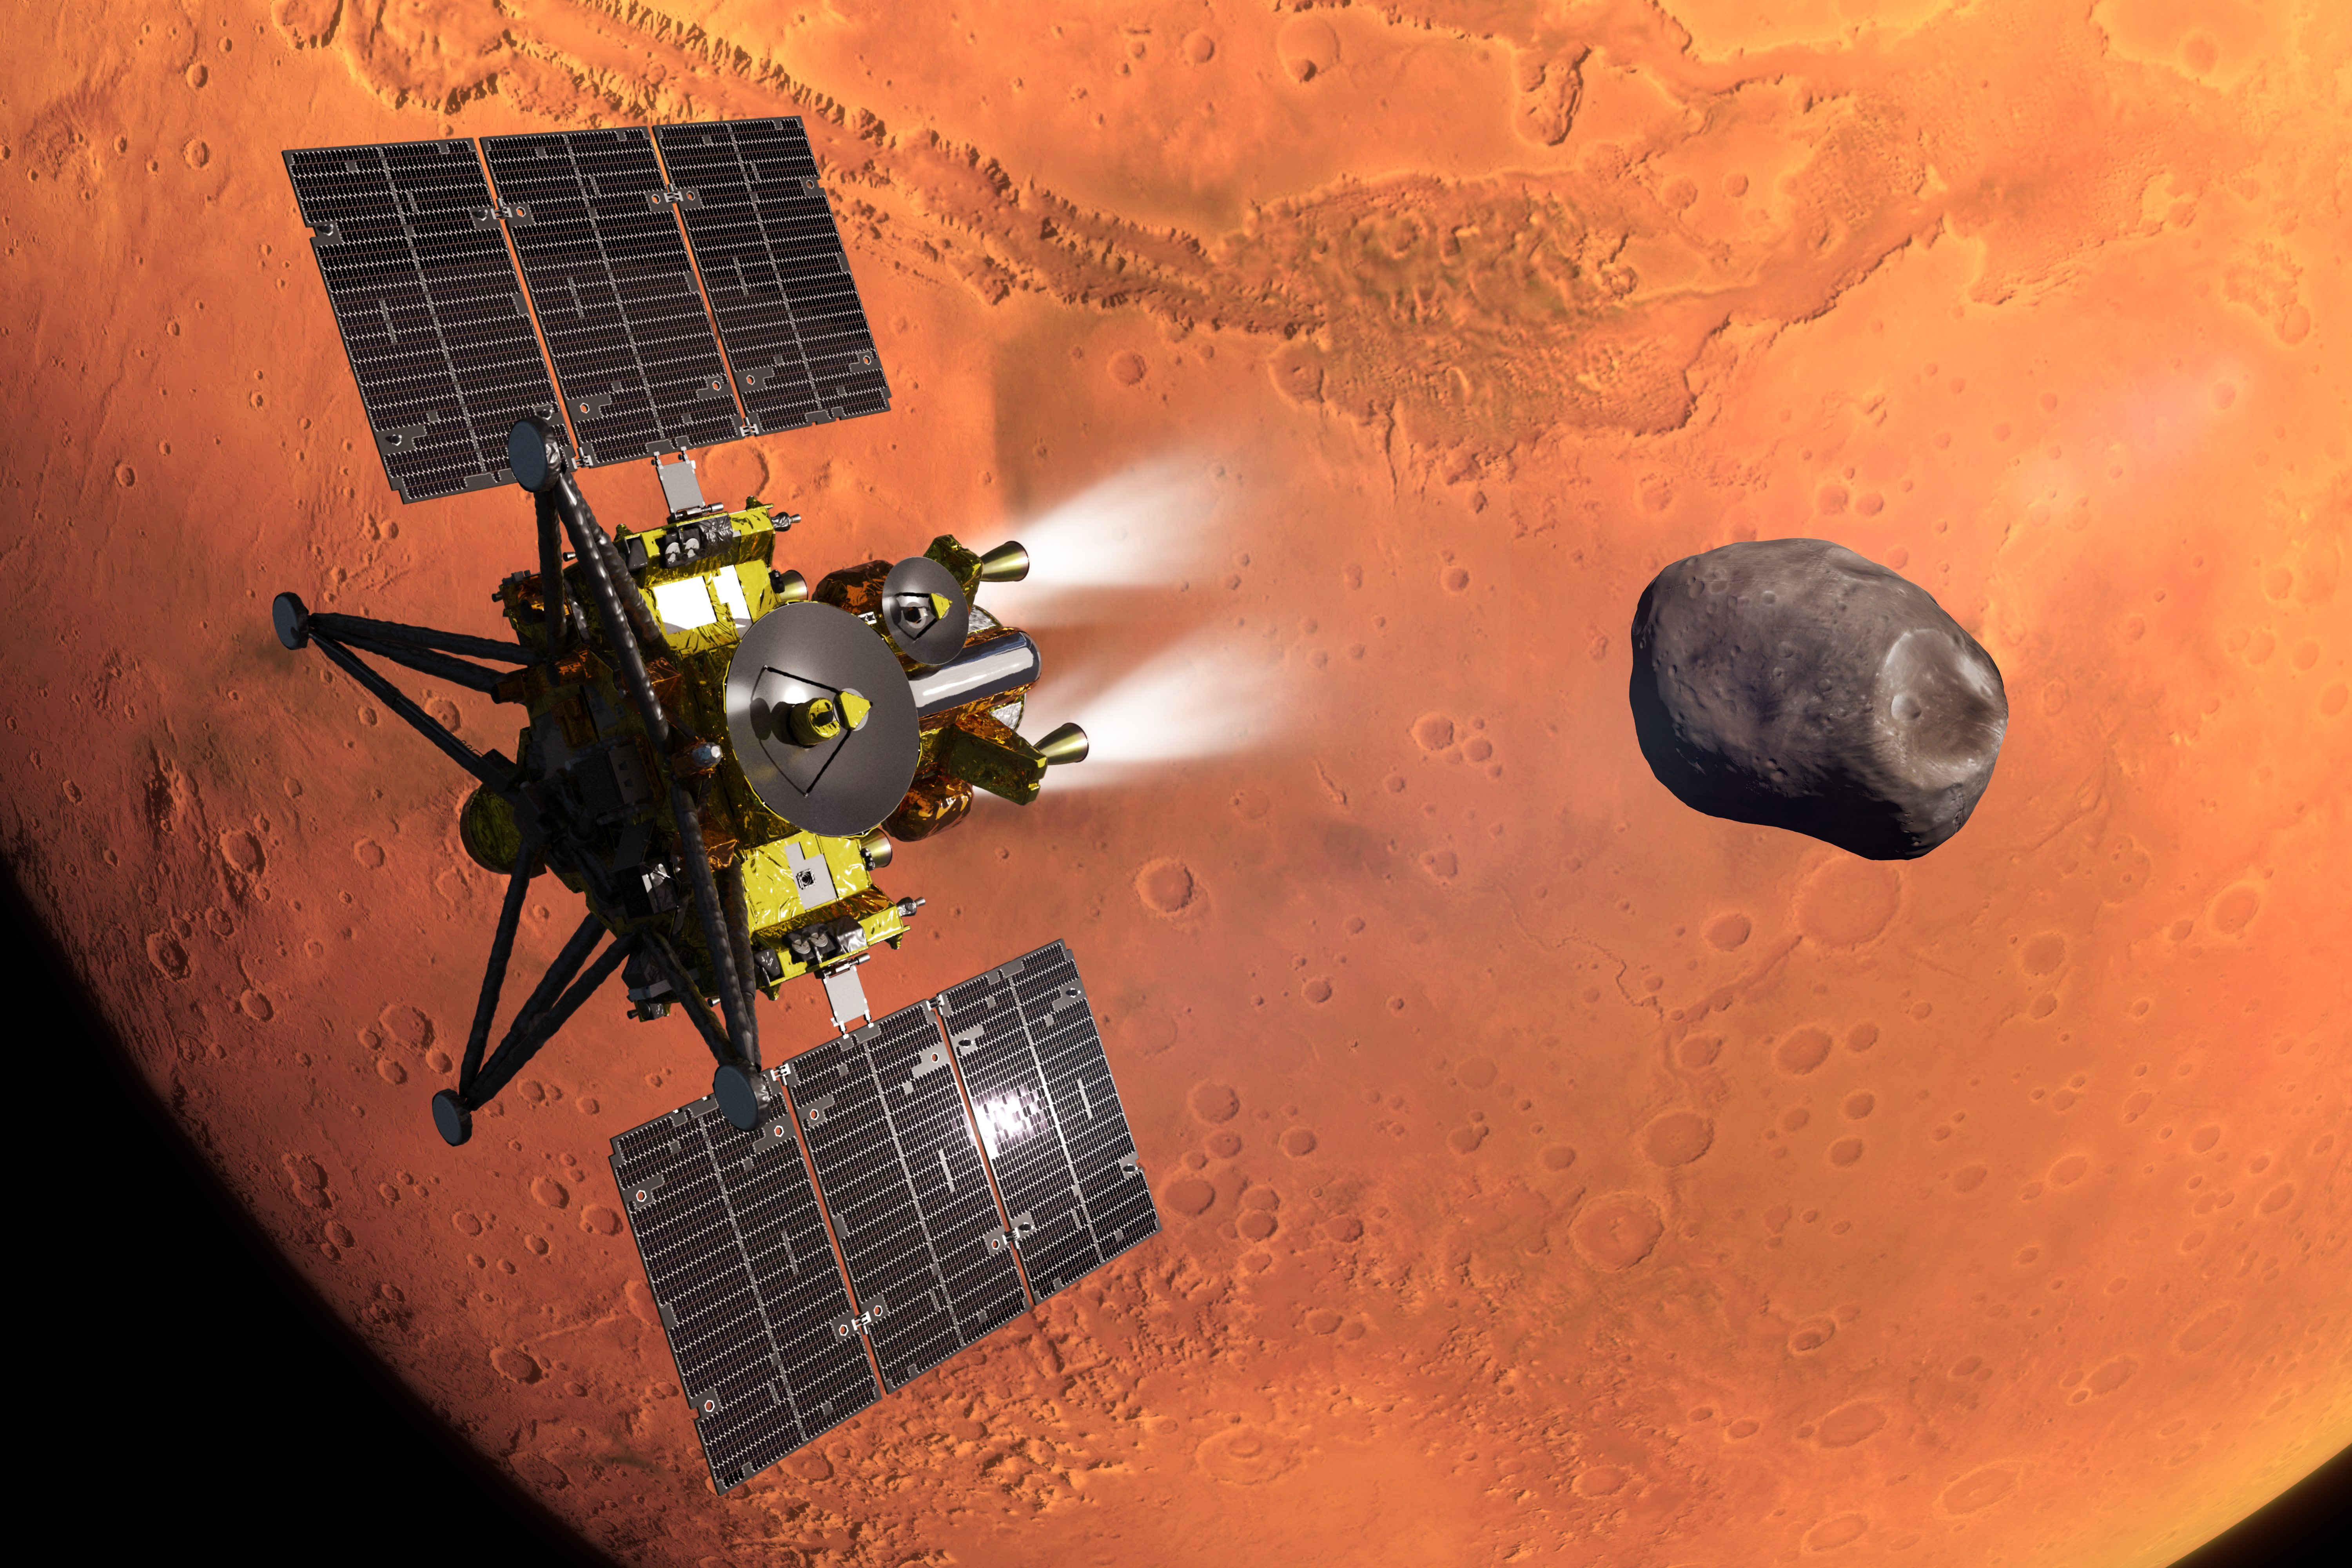
NASA is playing an important role in JAXA’s (Japan Aerospace Exploration Agency) MMX (Martian Moons eXploration) mission, to advance our understanding of Mars’ moons and build on the agency’s long history of exploring the Red Planet.
The mission aims to characterize and determine the origin of Mars’ moons Phobos and Deimos and deliver a sample of Phobos to Earth. The MMX spacecraft is targeting launch from JAXA’s Tanegashima Space Center in Japan at 3:41 p.m. EDT on Monday, Oct. 19 (4:41 a.m. JST on Tuesday, Oct. 20).
“The samples from MMX will bring forth paradigm-shifting science on the Mars system for generations to come, especially as NASA prepares to send the first humans to Mars,” said Nicky Fox, associate administrator, Science Mission Directorate, NASA Headquarters in Washington. “The NASA-JAXA sample curation partnership is extremely valuable, and I am proud that NASA Science is supporting MMX sample curation and will be sharing portions of these samples for study as we continue to expand humanity’s understanding of the universe for the benefit of all.”
NASA’s contributions to the mission include the Mars-moon Exploration with Gamma rays and Neutrons (MEGANE) spectrograph instrument, the Pneumatic Sampler (P-Sampler) technology demonstration, and communications and navigation support from the agency’s Deep Space Network, as well as funding United States scientists participating on the MMX science team.
Scientists have long debated the origin of Mars’ two moons. The data and samples collected by the MMX mission will help answer essential questions about the origins of these moons and the history of the solar system.
“Phobos and Deimos may be the remains of a massive impact on Mars that sent material into orbit around the planet, or they could be ancient asteroids that were captured by Mars’ gravity billions of years ago,” said Tom Statler, MMX program executive and program scientist at NASA Headquarters. “Having the answer will help illuminate that early era when Earth and the other inner planets may have been acquiring much of their water and organic compounds.”
The MEGANE (pronounced meh-GAH-nay, the Japanese word for eyeglasses) spectrograph will help scientists “see” what Phobos is made of by measuring neutrons and gamma rays emitted from the moon’s surface and determining its chemical elemental composition, which will provide important clues about its origin.
Mounted on one of the spacecraft’s landing legs, the P-Sampler is designed to collect a ground sample from Phobos. The system gathers surface material using bursts of high-pressure nitrogen gas, complementing JAXA’s C-Sampler, which will extract cores from a few inches deeper. NASA will obtain and curate about 15% of the total returned sample at the agency’s Johnson Space Center Astromaterials Lab in Houston, making it available for research for decades.
Another key part of NASA’s contribution to MMX is its scientific partnership with JAXA. NASA-supported researchers are working alongside international colleagues to help reveal the story of Phobos and will use mission data and returned samples to uncover new clues about the moon’s origin and the evolution of the Mars system.
The MMX spacecraft will arrive at Mars in August 2027 to begin its survey of the Red Planet’s two moons. After surveying Phobos in detail, the spacecraft will collect a sample of the moon’s surface no earlier than December 2028 and deliver it to Earth in 2031.
The MEGANE instrument was developed by the Johns Hopkins Applied Physics Laboratory. Honeybee Robotics, a Blue Origin company, developed the spacecraft’s pneumatic sampler mechanism. NASA’s contributions to the MMX mission were developed under the agency’s Discovery Program. The Discovery Program is managed by NASA’s Marshall Space Flight Center in Huntsville, Alabama, for the agency’s Science Mission Directorate in Washington.
For more information about the MMX mission, visit:
https://science.nasa.gov/mission/mmx
Karen Fox / Alana Johnson
Headquarters, Washington
240-285-5155 / 202-672-4780
karen.c.fox@nasa.gov / alana.r.johnson@nasa.gov
Explore More



NASA Satellites Observe Historic 2026 El Niño
2026-10-15 17:59
NASA Satellites Observe Historic 2026 El Niño
NASA’s Scientific Visualization Studio
A phenomenon rarer than a solar eclipse and more powerful than any single storm system is unfolding this fall, and NASA is tracking it closely.
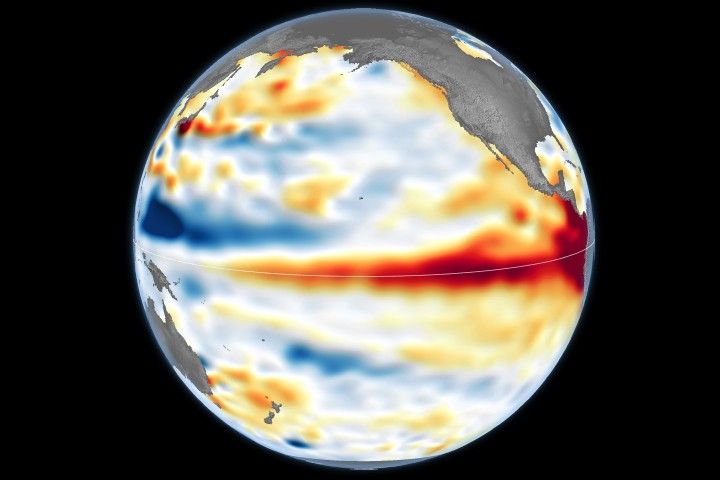
El Niño is a natural climate pattern that emerges roughly every two to seven years marked by warmer-than-normal water temperatures in parts of the equatorial Pacific. NASA scientists are keeping watch as it flips trade winds, redistributes ocean heat, scrambles rain patterns, and raises sea surface height across parts of the Pacific.
As of October, the National Oceanic and Atmospheric Administration (NOAA) has said that there’s an 83% chance that the strongest El Niño since 1950 is currently unfolding. People around the world, including farmers, firefighters, and coastal communities, are already experiencing the effects in different ways.
Follow along with these maps as NASA tracks El Niño from its epicenter in the equatorial Pacific Ocean.
Sea surface height in flux
One of the first clues appeared in satellite imagery in January 2026, when a swell of warm water called a Kelvin wave was spotted near Micronesia in the western Pacific. Kelvin waves are slow-moving pulses of water thousands of miles long. Like underwater freeways, they transfer heat from west to east across the Pacific. The warm water heats the air directly above it, making it rise. The change in air pressures weakens or even reverses the trade winds that typically blow in the opposing direction, from the Americas toward Asia, causing sea levels in the eastern Pacific to rise further, and waters to warm even more. This chain reaction signifies the start of an El Niño.
The map above shows that by early April, those Kelvin waves had reached the eastern Pacific, and sea surface temperatures had begun to warm. Warm water expands in volume, elevating local sea levels in some areas by as much as 1 to 1.3 feet (30 to 40 centimeters). The higher-than-normal water can be seen sloshing toward South America then moving up the coast to California. Sea levels that are six to eight inches (15 to 20 centimeters) lower than normal are visible around Indonesia and northern Australia.
“Kelvin waves are like the heartbeat of El Niño,” said Josh Willis, project scientist for sea level missions at NASA’s Jet Propulsion Laboratory in Southern California. “And our sea level satellites let us peer into the ocean and watch every beat.”
Scientists have used satellite altimetry to track the height of the ocean with ultraprecision since 1993. That unbroken data record continues today with the Sentinel-6 satellites. State-of-the-art radar altimeters aboard these satellites survey millions of square miles of ocean in a single day, complementing NOAA’s fleet of ocean sensors and buoys drifting and diving through the water below.
Warming Pacific waters
Warmer-than-normal seawater is one of the best-known indicators of El Niño. Already, sea surface temperatures in the eastern Pacific are about 3 degrees Fahrenheit (1.7 degrees Celsius) warmer than the long-term average and could jump another fraction of a degree in the coming months, Willis said.
Satellites carrying microwave and infrared radiometers can see through and around clouds to measure heat energy at the sea surface. Satellites in 2026 mapped the band of warmer-than-normal water as it expanded throughout the spring. The band, seen in dark red, stretches for millions of square miles from the heart of the Pacific to the coast of South America. Ocean temperatures can influence weather patterns around the world. Air above the water’s surface carries heat and moisture into the atmosphere, seeding rainstorms and rearranging weather patterns across the globe.
Ocean gets bluer
El Niño’s warm waters also change the color of the ocean. A NASA satellite is tracking these subtle shifts in hues, as equatorial Pacific waters have become measurably more blue over the last several months.
“Some people think of water as being just blue, but it’s amazing the multitude of colors the ocean can be,” said Matthew Kehrli, a lead research scientist for the PACE (Plankton, Aerosol, Cloud, ocean Ecosystem) satellite team at NASA’s Goddard Space Flight Center in Greenbelt, Maryland.
This spectrum is in part thanks to microscopic plants called phytoplankton, which form the basis of the marine food web. There are thousands of different species of phytoplankton, which come in shades like teal, brown, or green. This year, in areas of the Pacific Ocean along the equator that are typically lush with phytoplankton and greener as a result, these hues are waning.
This is an expected effect of El Niño. Phytoplankton thrive in cool, nutrient-rich waters, but during an El Niño, the weakening trade winds reduce the upwelling of nutrient-rich deep water to the ocean surface. With limited food supply, phytoplankton abundance drops. This decline can trigger cascading effects across the marine food web, forcing other marine life to relocate to new feeding grounds.
This year’s El Niño is the first since PACE launched in 2024, providing new views of the phenomenon. The Ocean Color Instrument aboard PACE observes the ocean in hyperspectral color — across several hundred different wavelengths of visible, near-infrared, and ultraviolet light — monitoring phytoplankton and other ocean-color changes in near-real time. With PACE data, researchers calculate the average color of the ocean, simplifying spectra of light into a single number, known as apparent visible wavelength.
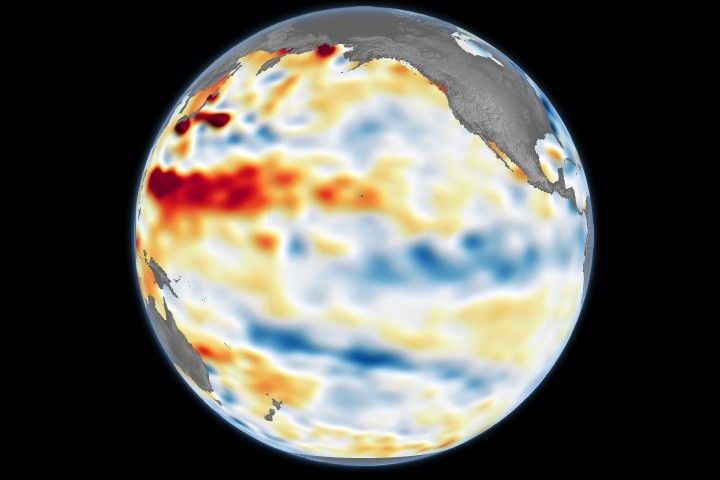
The 2026 map above shows the green area along the equator in the western Pacific Ocean shrink as a bluer shade fills in, indicating fewer phytoplankton. In contrast, the map from 2025 shows how the green-hued section stays steady over time.
“You have expectations of what you would think would happen,” Kehrli said. “But to visually see the results with the data products that you’re working with in real time is gratifying.”
NASA scientists will continue to monitor the signs and impacts of this El Niño with its fleet of Earth-observing satellites.
“El Niño touches almost all of us in some way every time it occurs,” Willis said. “While many have seen what it can do, we look to the ocean to understand why.”
View and download these data visualizations here.
Share
Details
Related Terms
Explore More



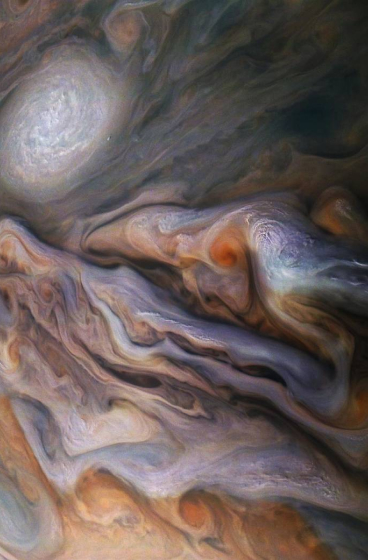
Power Up: Roll Out Solar Arrays Boost Space Station Power Supply
2026-10-15 17:30
Power Up: Roll Out Solar Arrays Boost Space Station Power Supply
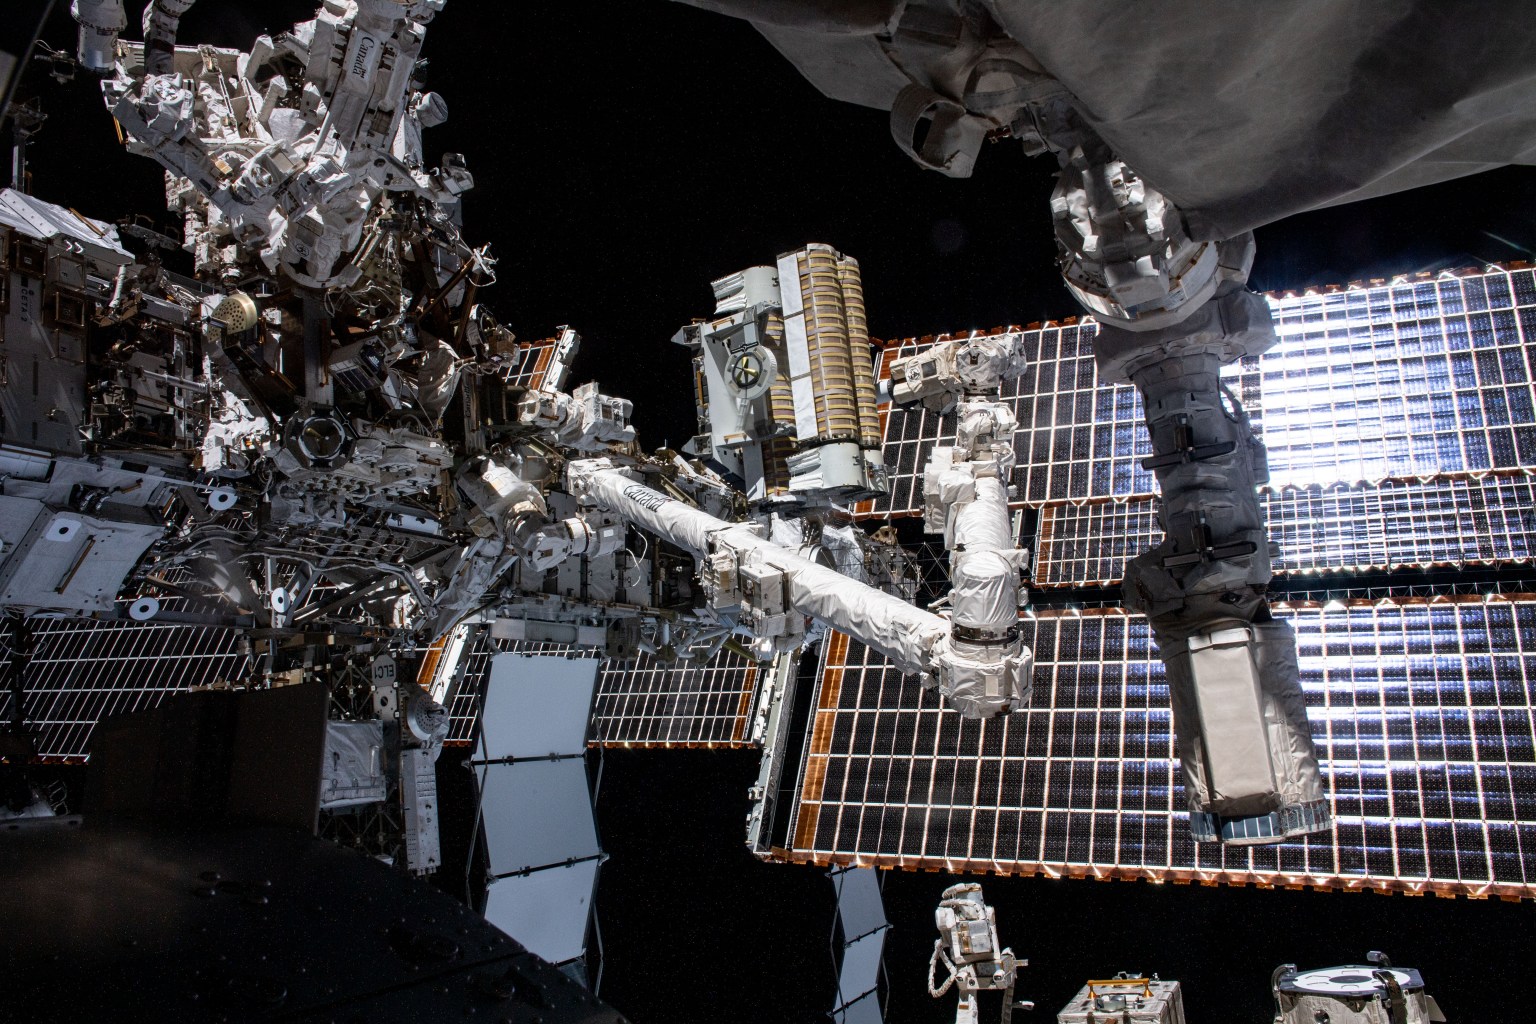
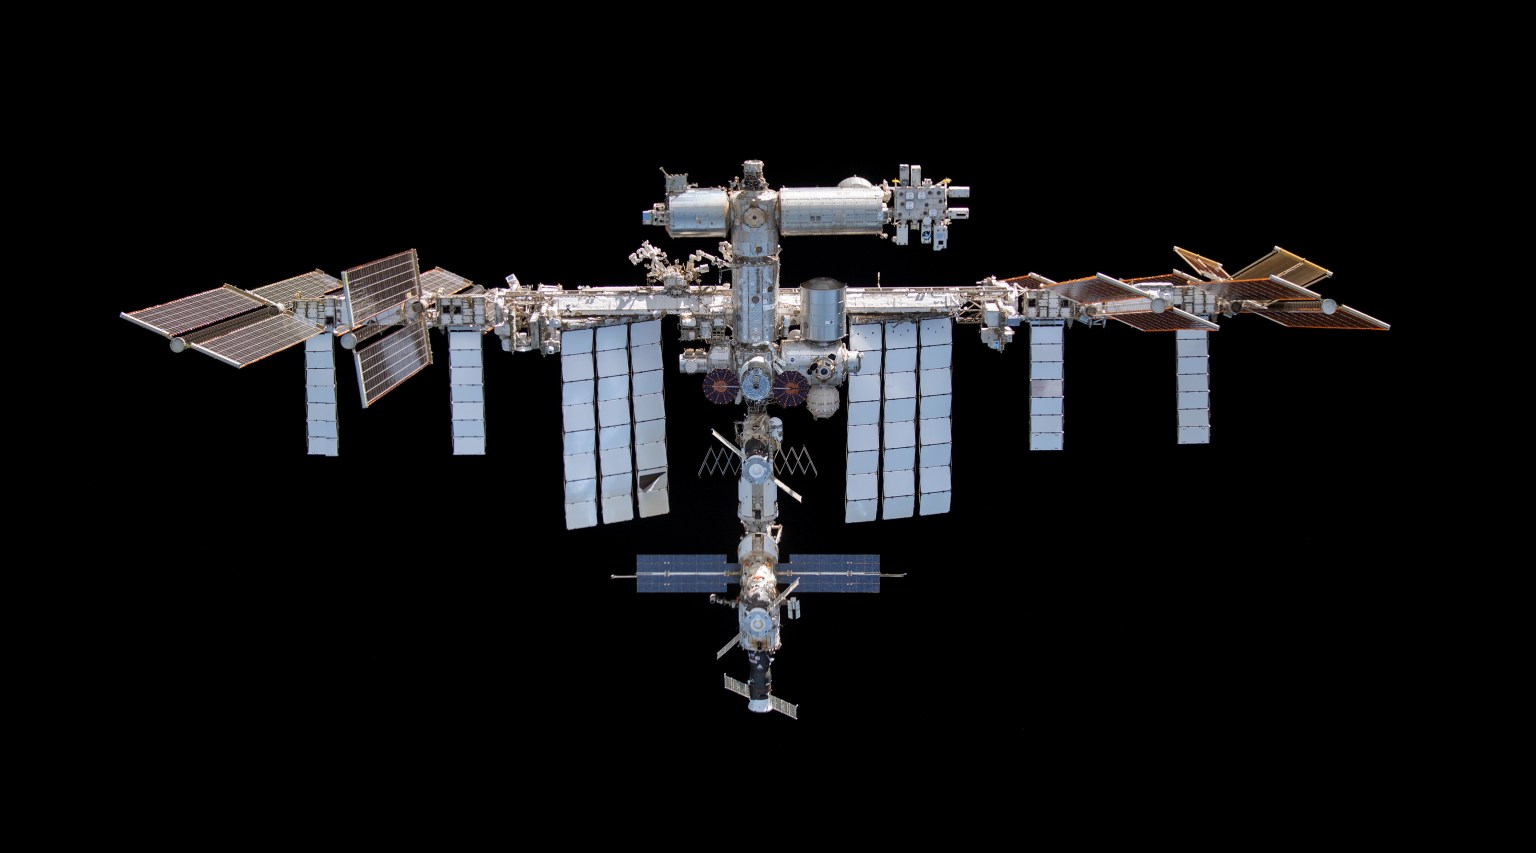
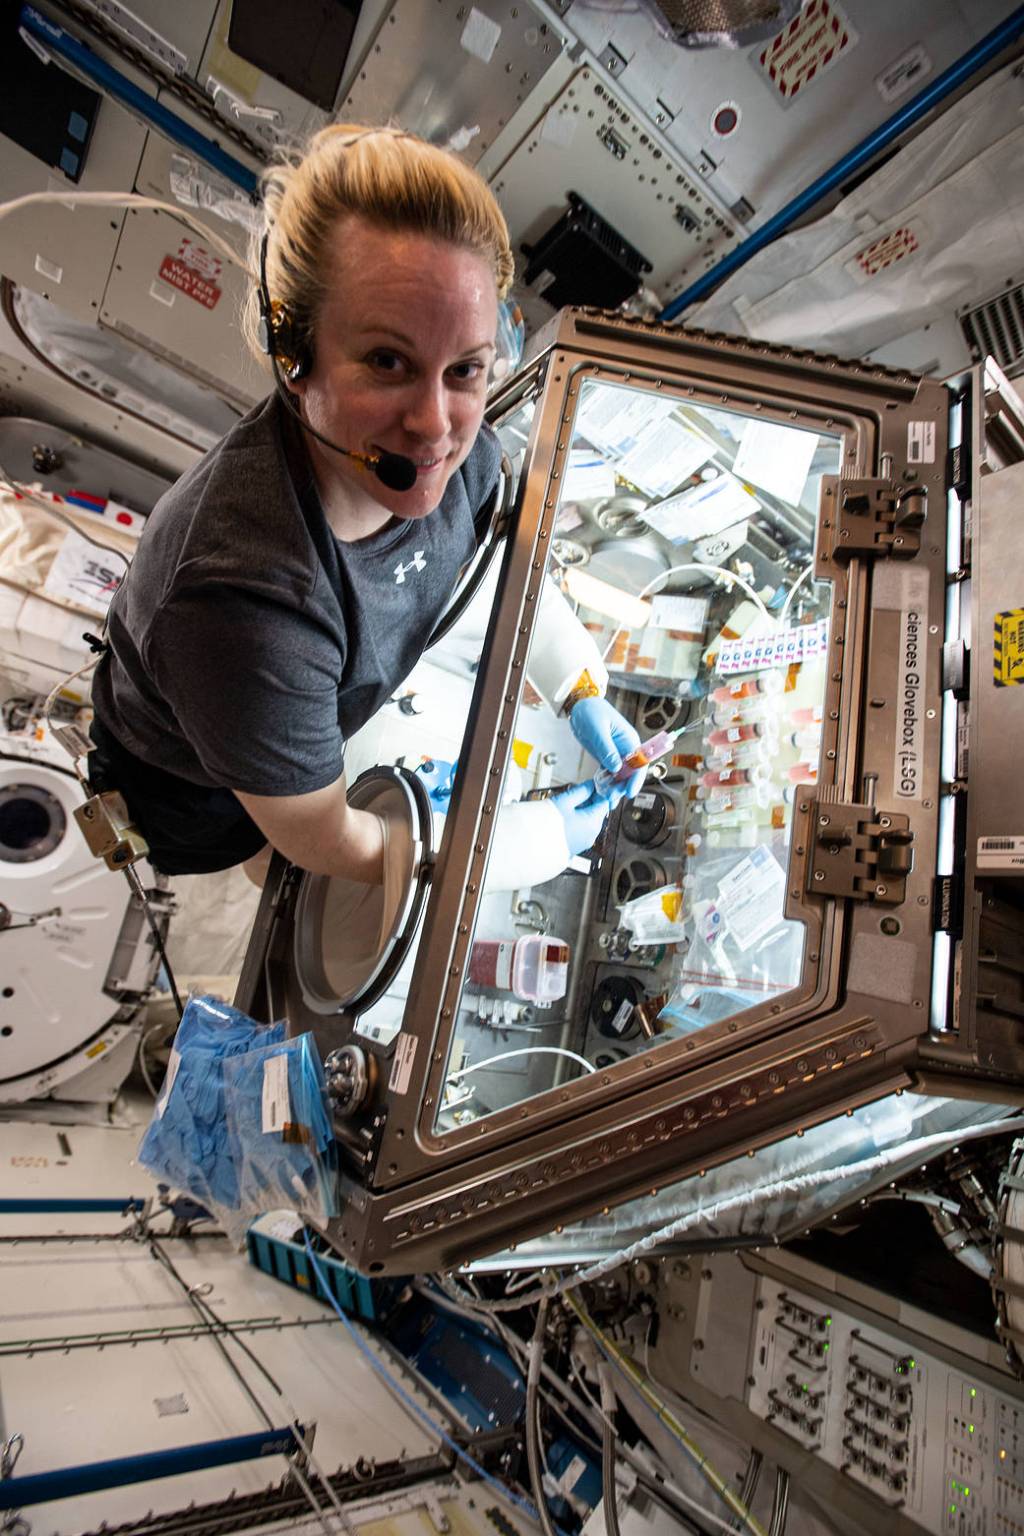
From the International Space Station’s unique position 250 miles above Earth, the Sun is a vital source of energy. Solar power supports the station’s life support systems, daily activities, and hundreds of research investigations that improve life on Earth and prepare humans for deep space exploration. Over the past five years, NASA augmented the station’s power generation and distribution capability with next-generation International Space Station Roll Out Solar Arrays (IROSAs).
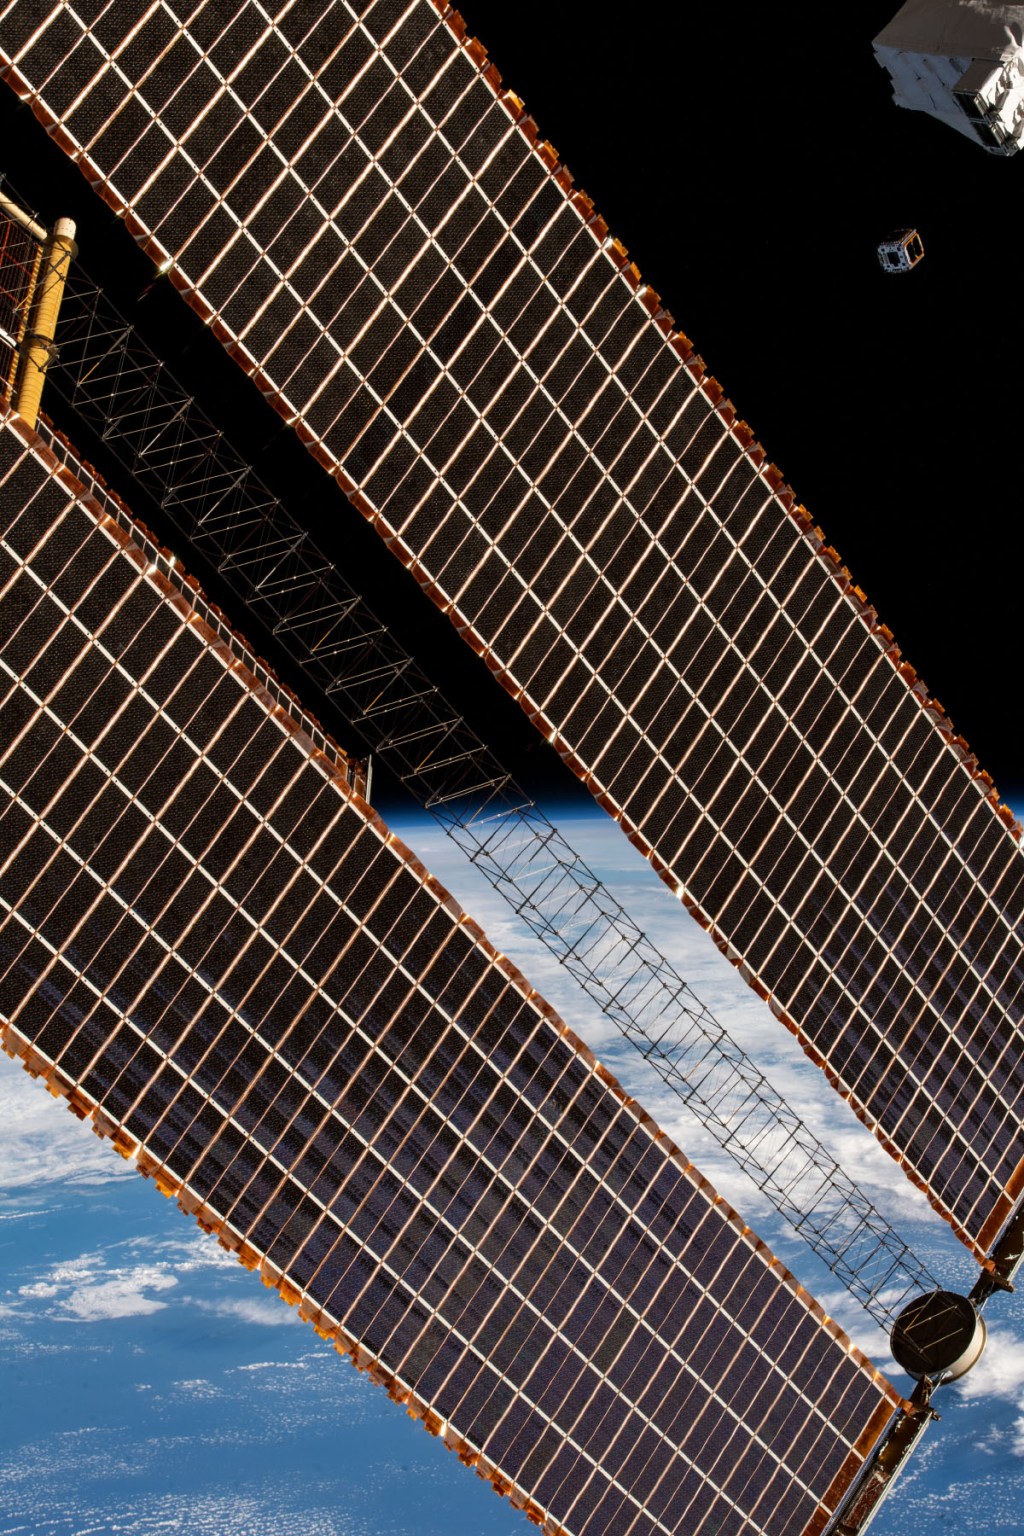
In 2017, a technology demonstration conducted aboard the space station tested the effectiveness of the arrays. The lightweight, compact design launches as a cylinder and unfurls like a yoga mat after installation. This advanced design reduces mass and volume at launch and uses an autonomous, self-deploying system that minimizes risks during rollout.
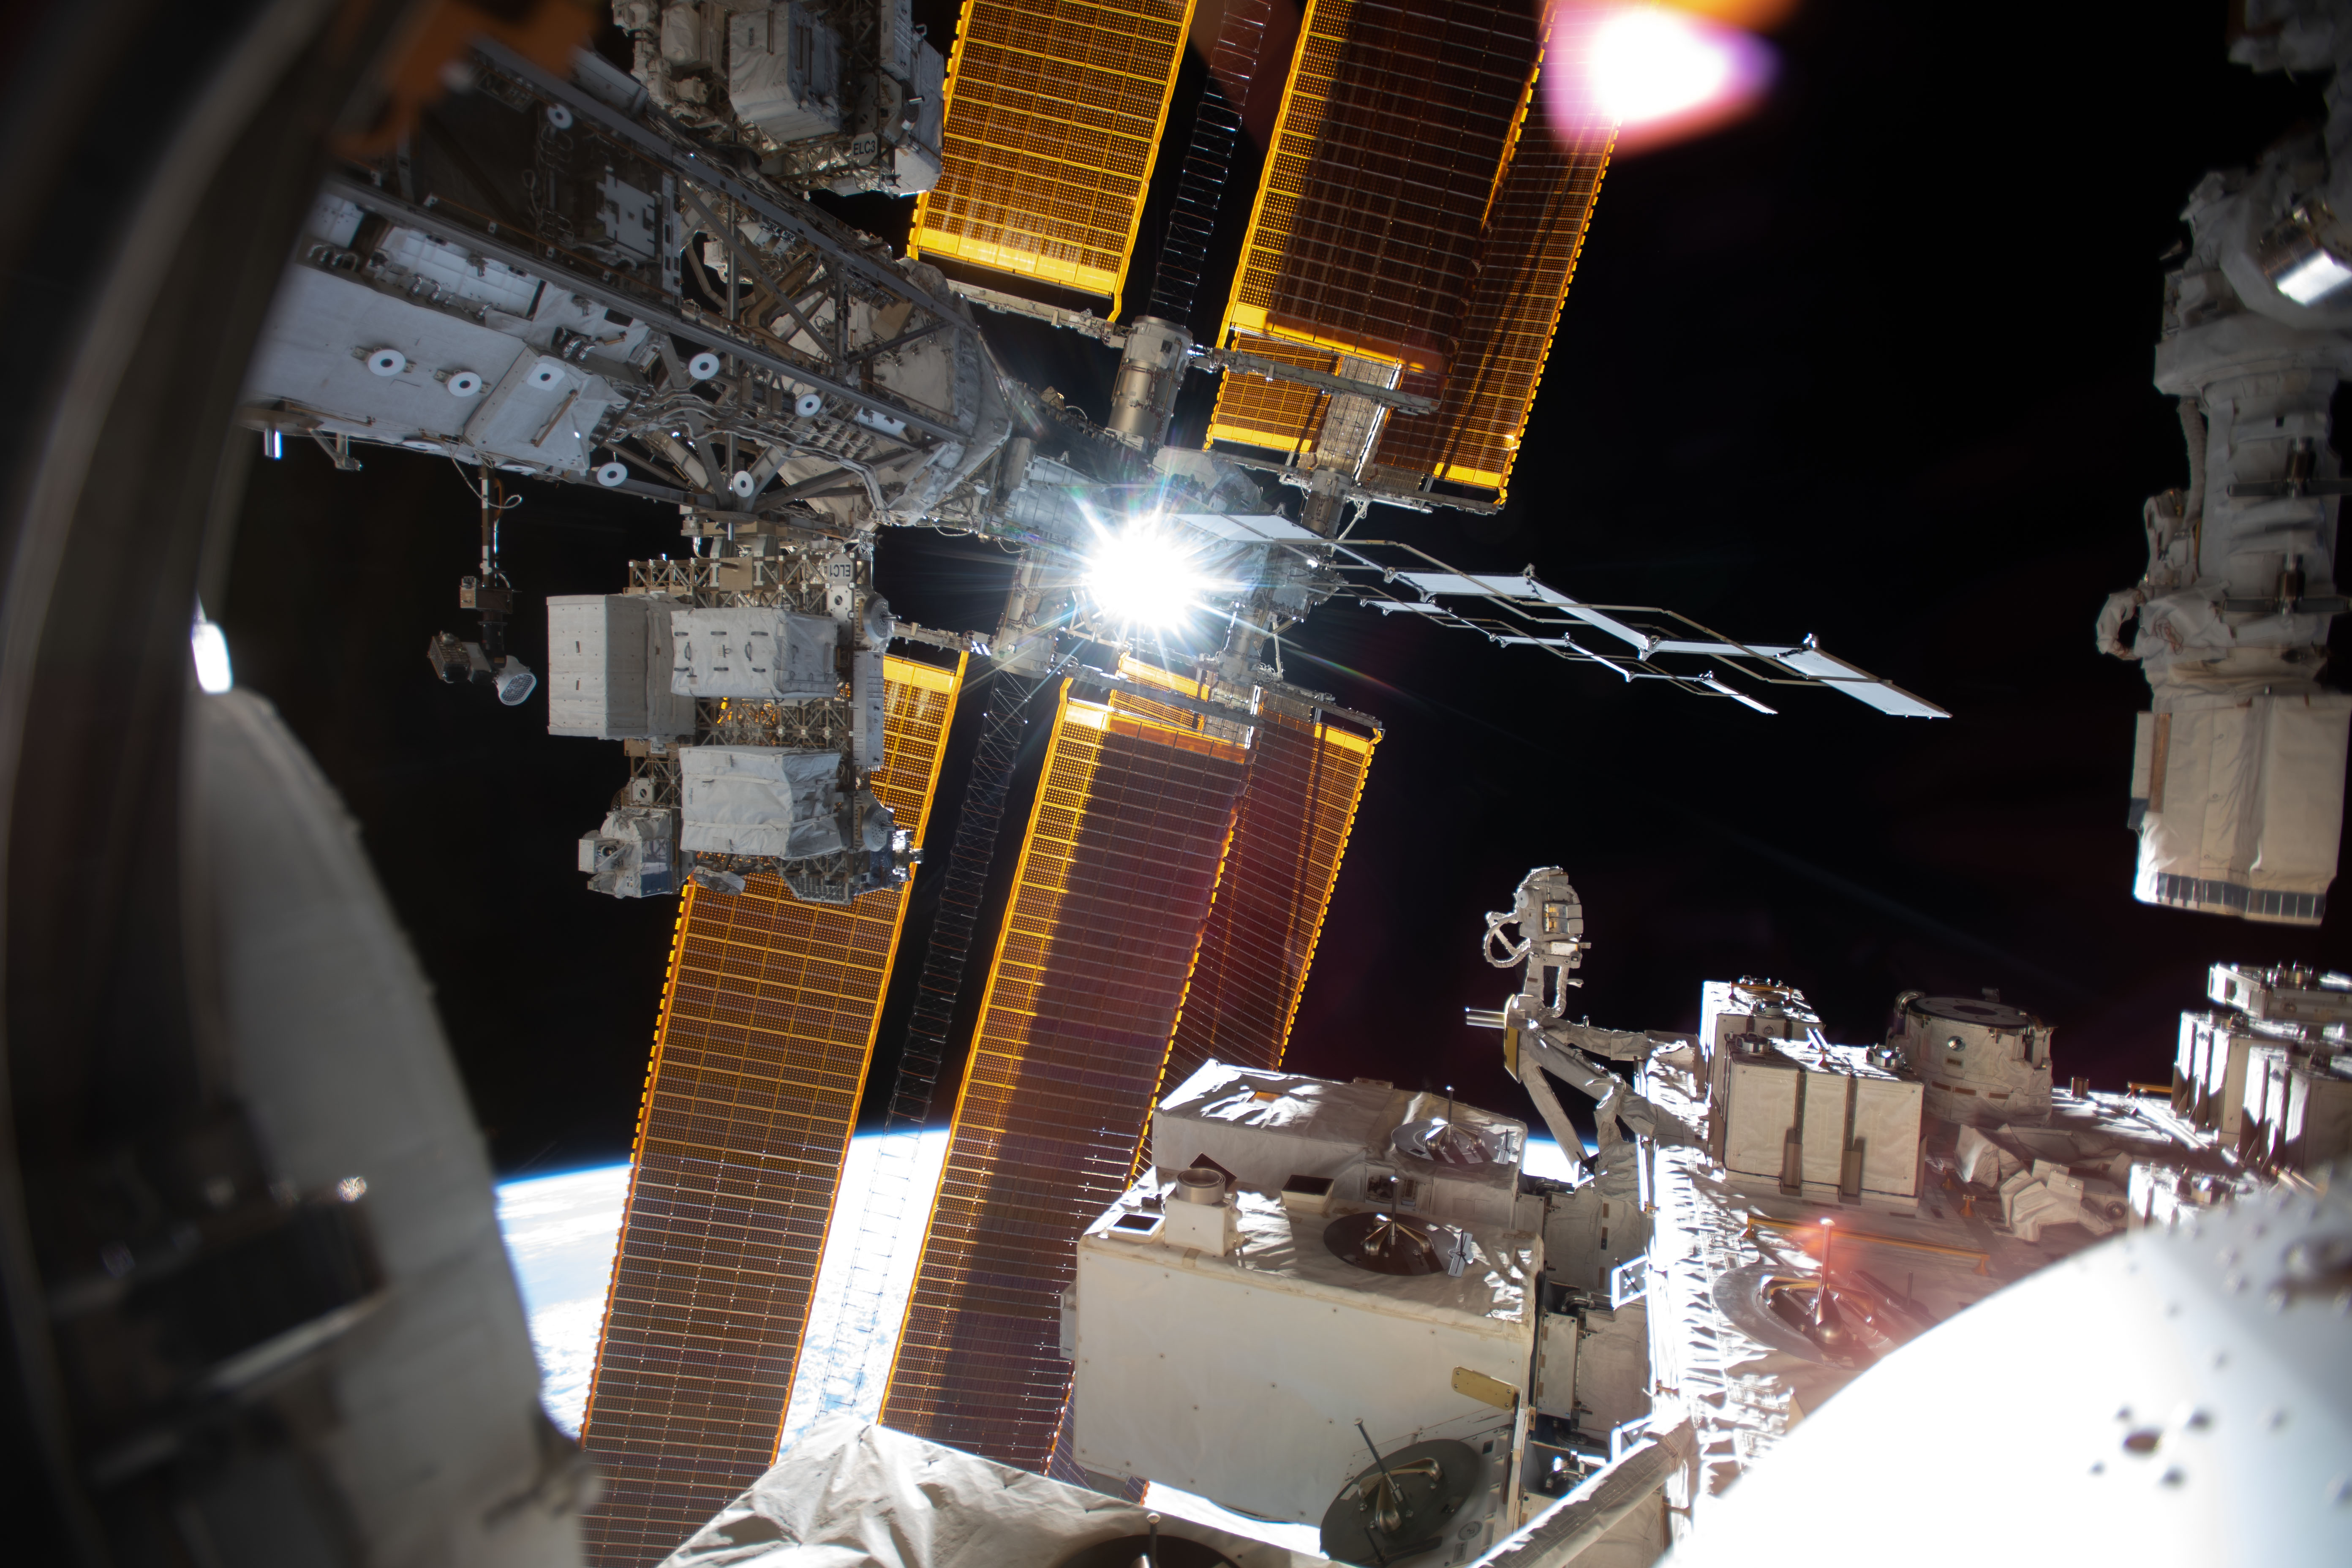
The IROSAs were designed, manufactured, and tested by Redwire under a contract with Boeing and are about half the size of the station’s legacy arrays. Despite being smaller, the arrays are capable of producing about 28 kilowatts of additional power.
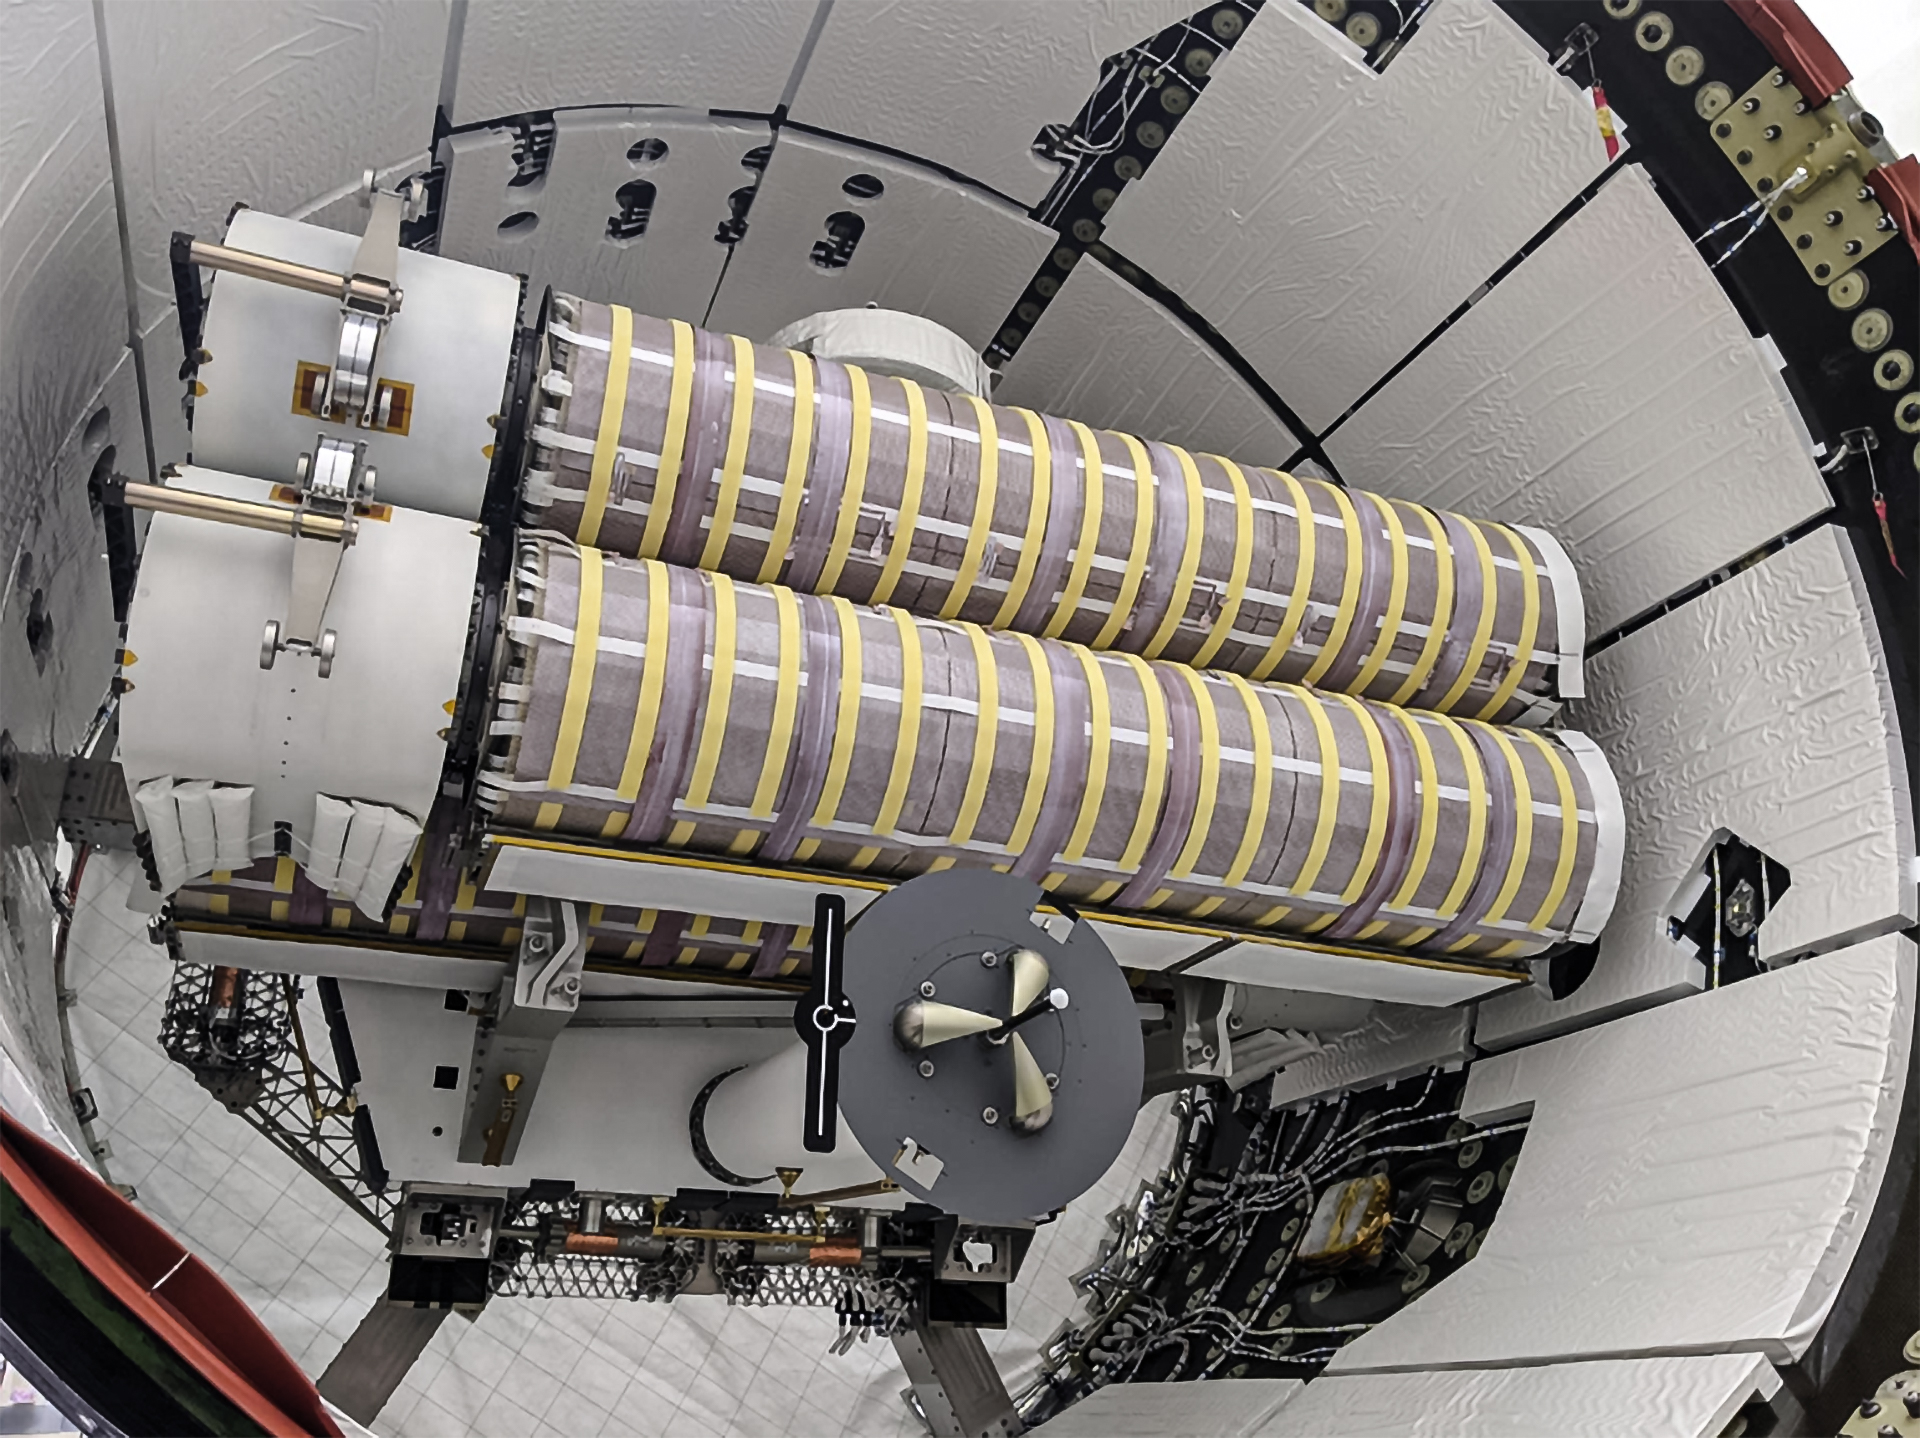
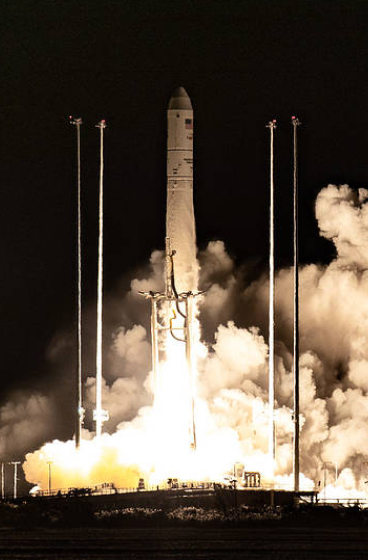
Six IROSAs were installed outside of the space station between 2021 and 2023. In 2023, power projections prompted a request for another set of IROSAs, which launched in Dragon spacecraft’s trunk during the SpaceX 35th commercial resupply services mission to space station for NASA. Together, the eight IROSAs will increase power by more than 160kW for research and operations.

With the full upgrade in place, the space station’s revitalized power system not only supports NASA’s legacy in low Earth orbit but also helps advance technology that will extend the agency’s reach into the solar system. From planetary defense demonstrations, like the Double Asteroid Redirection Test, to future human exploration efforts, the space station is an essential testbed for the technologies needed for expeditions beyond Earth’s orbit.

NASA to Conduct Low-Altitude Flights Over Texas Farmland
2026-10-15 16:42
A NASA Dynamic Aviation A200 aircraft will conduct low-flying research flights over farmland near Transit, Texas, from Thursday, Oct. 22, through Monday, Nov. 9. These flights will measure gaseous and particulate emissions from animal feeding operations.

Agricultural emissions represent an important and understudied part of Earth’s land and atmosphere systems. The FarmFlux mission will deploy more than a dozen sensors to measure ozone, methane, ammonia, particulates, and other pollutants rising from crop lands and livestock farms and their interaction with the Earth’s atmosphere. The mission is jointly led by NASA’s Goddard Space Flight Center in Greenbelt, Maryland; Colorado State University; and Boston University.
Additional low-altitude research flights with a NASA P-3 Orion aircraft are scheduled for the March to July 2027 growing season in the Midwest and California’s Central Valley with a focus on cropland.
For more information about the FarmFlux mission, visit:
https://science.nasa.gov/mission/evs-4/farm-flux/
By Sharon Teitelbaum
NASA’s Ames Research Center in California’s Silicon Valley
NASA Welcomes All Ages, Experience Levels for Space Apps Challenge
2026-10-15 16:13
Registration is open for the 2026 NASA Space Apps Challenge, a two-day global event on Saturday, Nov. 14 and Sunday, Nov. 15, where teams work to create solutions inspired by NASA’s most ambitious exploration goals and making use of the agency’s free and open data. The annual challenge, often called a hackathon, is an intensive, collaborative problem-solving experience where participants tackle real-world challenges created by NASA subject matter experts.
This year’s Space Apps Challenge collectively supports three major focus areas: returning humans to the Moon, preparing for missions deeper into the solar system, and expanding understanding of the universe. Participants do not have to be programmers. Students, scientists, engineers, designers, storytellers, technologists, and space enthusiasts of all ages and experience levels can contribute their skills.
“At NASA, science is for everyone, and we’re inviting the next generation to help tackle some of humanity’s most critical challenges in space through the NASA Space Apps Challenge,” said Nicky Fox, associate administrator, Science Mission Directorate, NASA Headquarters in Washington. “Everything in NASA Science is interconnected, and this year, students from around the world can use NASA’s powerful data sets to help us build the ultimate interplanetary survival guide – supporting the science that will enable astronauts to thrive on the Moon and, eventually, Mars, while also inspiring ideas that improve everyday life on Earth and in space for the benefit of all.”
Supporting lunar exploration, Artemis planning
NASA continues to advance plans for a sustained human presence on the Moon through the Artemis program and Moon Base. Several of this year’s Space Apps challenges relate to analytical tools, operational considerations, and human‑system needs relevant to lunar missions. These include work related to surface operations at the Moon’s South Pole, the management of environmental constraints such as sunlight and communications windows, as well as approaches for evaluating the logistical and scientific demands of long‑duration lunar stays. Broader system‑level modeling challenges, such as those that simulate outpost operations or consider astronaut health and safety, mirror the complexity of planning for human activity on the lunar surface.
Strengthening readiness for Mars, deep space
NASA’s exploration strategy includes continued robotic exploration of the outer solar system and preparing for future human missions to Mars. Several challenges involve operational concepts for Martian surface activities, integrating data from multiple Mars missions, or reflecting the mission‑design trade‑offs required for deep‑space exploration. Others address fundamental concerns for long‑duration travel, such as monitoring physiological and behavioral health indicators, or examining how engineering and scientific choices shape mission execution in environments far from Earth.
Some of these challenges also align with NASA’s broader exploration portfolio, which includes ongoing work on future missions to destinations such as Jupiter’s moon Europa and Saturn’s moon Titan. By simulating mission‑design decisions or evaluating environmental analogs on Earth, certain challenges offer frameworks related to how NASA prepares for complex operational scenarios throughout the solar system.
Enhancing access to astrophysics
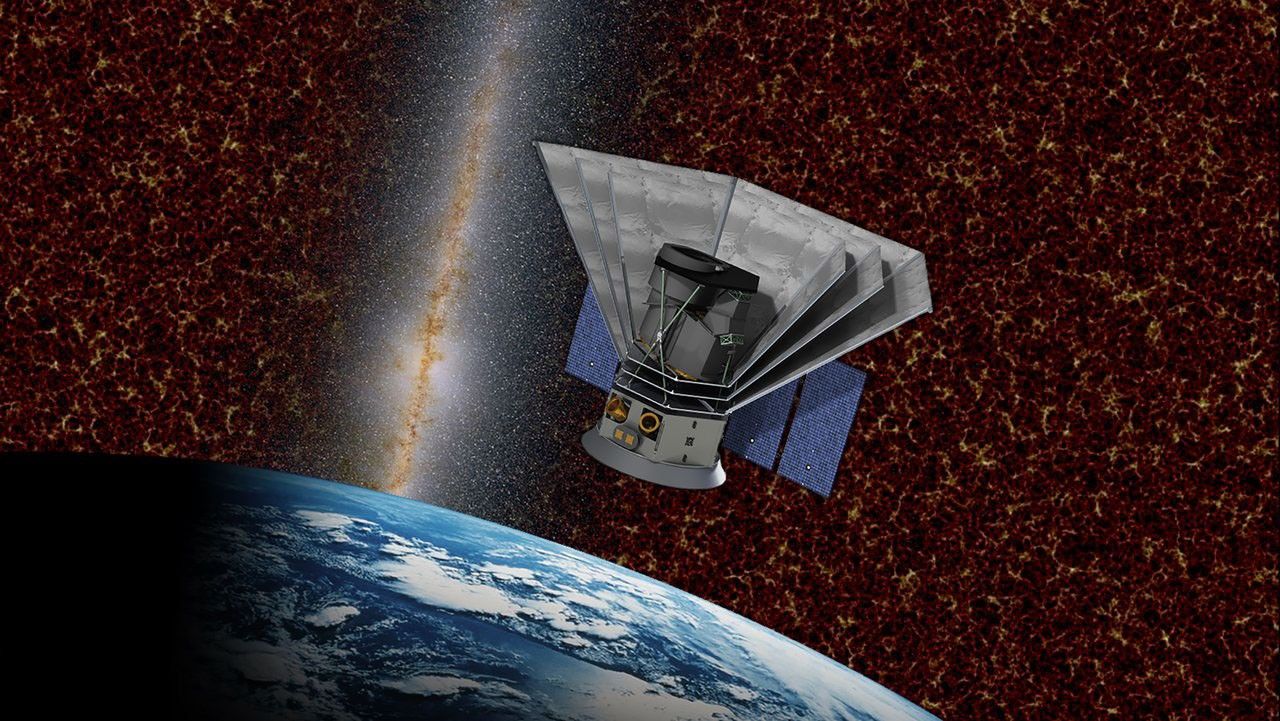
NASA’s astrophysics missions contribute to understanding the structure and history of the universe. In 2026, this includes active missions like Spectro-Photometer for the History of the Universe, Epoch of Reionization and Ices Explorer (SPHEREx), which is conducting a full‑sky spectral survey, as well as the continued development and deployment of observatories designed to investigate cosmic evolution and exoplanet, which are planets outside our solar system, populations.
Challenges associated with these efforts focus on improving public access to mission data, designing tools that help visualize changes in the sky over time, and supporting broader engagement with the scientific products derived from these missions.
Broader impact across NASA’s mission landscape
Together, these challenges illustrate how NASA’s open data ecosystem enables gold standard science, by freely offering such a wide breadth of information and research. By engaging with the Space Apps event, the entire nation can interact with the kind of real‑world needs defined by the agency.
Registration is available at the NASA Space Apps Challenge. Participants can join in one of 500+ local events, join a team, and select the challenge that they are most interested in addressing during the November hackathon.
TechCrunch - Latest
Amazon devices chief Panos Panay on the importance of failure and bouncing back from it
2026-10-15 20:38
Meta launches an open-weight AI model that runs on Macs
2026-10-15 20:04
Amazon devices chief Panos Panay sees a future where AI devices replace the need to use apps
2026-10-15 19:55
Bluesky wants to make it easier to buy, sell, and fundraise on the network
2026-10-15 19:29
Anthropic is letting METR researchers look under the hood with employee-level access
2026-10-15 19:14


