📰 Trending Topics
Google News - Trending
Why Is This Surprising Taylor Swift Deep Cut Trending? - Rolling Stone
2026-10-10 14:00
Google News - Technology
Microsoft Weekly: New Surface Laptop, Local AI, and Microsoft 365 Family storage cuts - Neowin
2026-10-10 15:30
- Microsoft Weekly: New Surface Laptop, Local AI, and Microsoft 365 Family storage cuts Neowin
- Microsoft to sell $2,599 Surface Laptop Ultra containing Nvidia AI chip CNBC
- Building Windows for hybrid intelligence Windows Blog
- Microsoft event debuts new AI-friendly hardware and Windows changes Ars Technica
- NVIDIA, Microsoft Kick Off a New Beginning for Windows PCs With RTX Spark and AI Agents NVIDIA Blog
Apple discloses deal to hire team and license tech from personalized podcast startup Huxe - TechCrunch
2026-10-10 19:50
- Apple discloses deal to hire team and license tech from personalized podcast startup Huxe TechCrunch
- Apple acqui-hires AI startup founded by former NotebookLM developers 9to5Mac
- Apple Acqui-Hires Huxe, Licensing AI Podcast Technology From Raiza Martin: how 16 outlets framed it NewsCord
- Apple Licenses Huxe’s AI Audio Tech and Can Hire Some Staff FourWeekMBA
- Apple notified EU regulator in June of plan to buy AI podcast generator Huxe MLex
Apple's All-New Home Hub Will Be Revealed October 13: What to Expect - MacRumors
2026-10-10 13:58
- Apple's All-New Home Hub Will Be Revealed October 13: What to Expect MacRumors
- I’m Way Too Excited for Apple’s Home Event and How It Will Level Up My Siri Experience CNET
- Apple to Launch Doorbell, Lock, Thermostat Developed With LG Bloomberg.com
- Apple sets NYC ‘experience’ next week to showcase new smart home devices Macworld
- Mark Your Calendar: Six Important Apple Dates Coming Up This Month MacRumors
The iPhone Duo’s Unfolding Animation Is Giving Z Fold 8 Owners FOMO, but Not Me - CNET
2026-10-10 09:00
- The iPhone Duo’s Unfolding Animation Is Giving Z Fold 8 Owners FOMO, but Not Me CNET
- Galaxy Z Fold 8 is already beating the foldable iPhone in a way I can’t ignore PhoneArena
- iPhone Duo vs Galaxy Z Fold 8: Apple’s $1,999 Foldable Is Heavier, Tougher and $100 Dearer Technology Org
- Apple iPhone Duo Vs. Motorola Razr Ultra: How Do These Foldables Compare? Engadget
- Survey suggests that the iPhone Duo is tempting a surprising number of Android fans Android Authority
NASA - Breaking News
APOD: 2026 October 11 – Ice Fishing for Cosmic Neutrinos
2026-10-11 04:05
APOD
Astronomy Picture of the Day
Discover the cosmos! Each day a different image or photograph of our fascinating universe is featured, along with a brief explanation written by a professional astronomer.
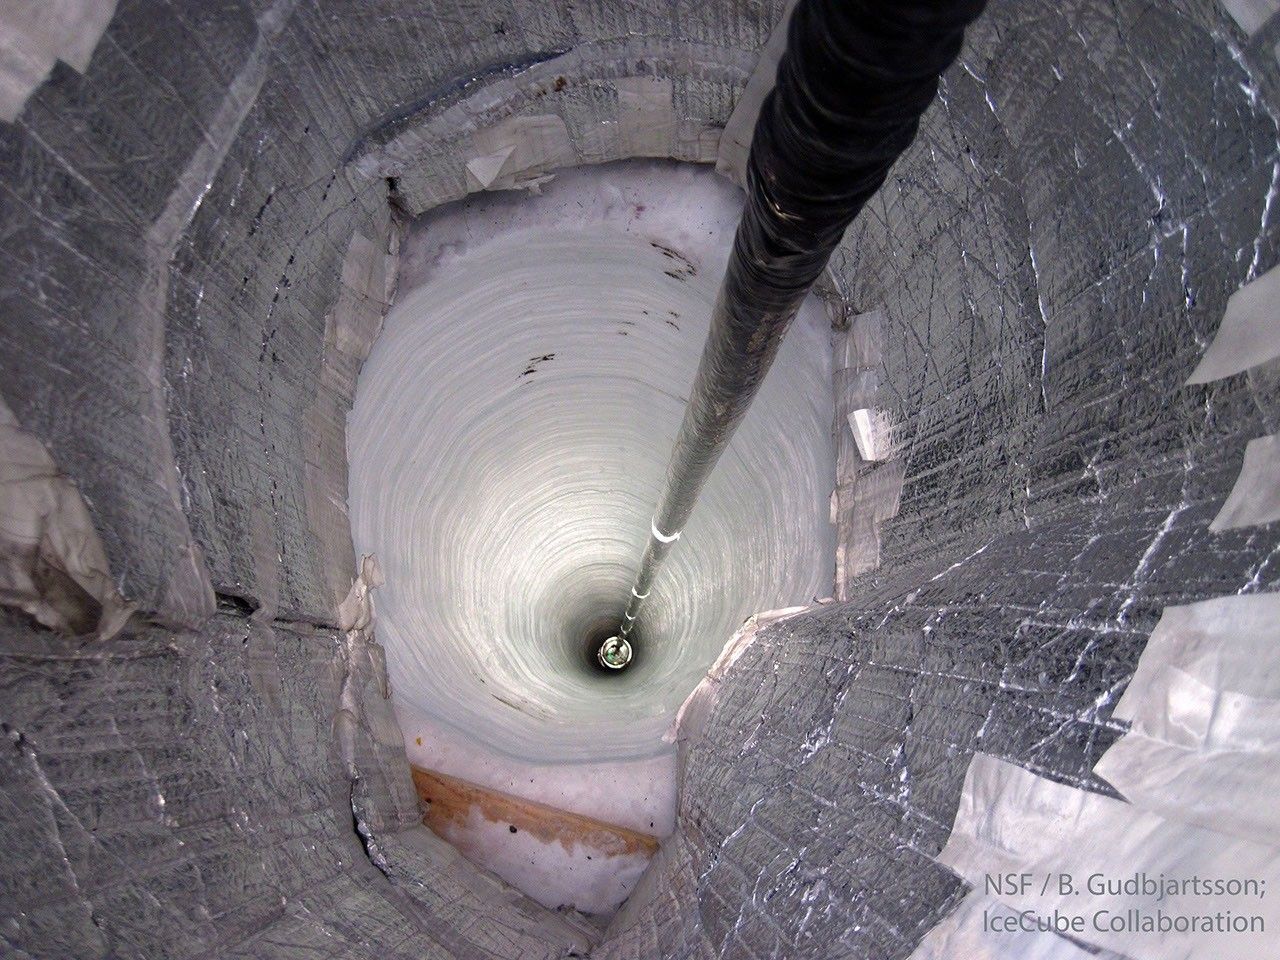
Ice Fishing for Cosmic Neutrinos
Explanation: Scientists are melting holes in the bottom of the world. In fact, almost 100 holes melted near the South Pole are now being used as an astronomical observatory. Astronomers with the IceCube Neutrino Observatory lowered a long string knotted with basketball-sized light detectors into each vertical lake. The water in each hole soon refreezes. The detectors attached to the strings are sensitive to blue light emitted in the surrounding clear ice. Such light results from fast-moving secondary particles liberated when high-energy neutrinos emitted by powerful processes out in the universe collide with ice molecules. IceCube has now detected many illuminating neutrinos. Pictured in 2010, one of the last of IceCube’s detector strings is lowered into the freezing abyss, making IceCube the largest neutrino detector ever created. In recognition of unprecedented discoveries, it was announced earlier this week that a founding leader of the IceCube Collaboration will be awarded the Nobel Prize in Physics.
Tomorrow’s picture: Moons Planet
| Date: | October 11, 2026 |
|---|---|
| Credit: | NSF, B. Gudbjartsson, IceCube Collaboration |
| Authors & editors: | Robert Nemiroff, Jerry Bonnell, Cecilia Chirenti, Keighley Rockcliffe |
| A service of: |
ASD at NASA / GSFC, NASA Science Activation & Michigan Tech. U. |
NASA to Conduct Flyover, Engage NFL Fans at MetLife Stadium
2026-10-10 14:18

As part of the agency’s Inspiration Tour flyover, NASA Administrator Jared Isaacman will pilot one of three F-5 fighter jets to kick off the New York Jets vs. Cleveland Browns game in East Rutherford, New Jersey, on Sunday, Oct. 11.
NASA team members will engage with fans at the agency’s Experience Zone, located at the Jets Tailgate Zone outside the stadium, from 10 a.m. to 1 p.m. EDT before the game. Fans can learn more about NASA’s return to the Moon under the agency’s Artemis dome, enjoy interactive games, and capture photos with a large, inflatable SLS (Space Launch System) rocket.
Isaacman will be available for limited media interviews during the game. To arrange interviews, please contact Camille Gallo at: camille.m.gallo@nasa.gov or 202-531-8057.
With stops across the nation, NASA’s Inspiration Tour convenes academic, industry, and public sector stakeholders to connect the agency with the people, technologies, and organizations that drive American leadership in space.
The tour will culminate in MAX POWER, a public exposition of American air and space innovation, Saturday, Nov. 7, and Sunday, Nov. 8, on and near the agency’s Kennedy Space Center in Florida. Held in honor of America’s historic 250th anniversary, the multi-day, family-friendly event will showcase the next-generation aircraft, spacecraft, autonomous vehicles, and technologies that will help define the future of transportation in air and space.
For more information about MAX POWER and the agency’s missions, visit:
-end-
Camille Gallo / Jessica Taveau
Headquarters, Washington
202-358-1600
camille.m.gallo@nasa.gov / jessica.c.taveau@nasa.gov
APOD: 2026 October 10 – Lunar Farside
2026-10-10 04:05
APOD
Astronomy Picture of the Day
Discover the cosmos! Each day a different image or photograph of our fascinating universe is featured, along with a brief explanation written by a professional astronomer.
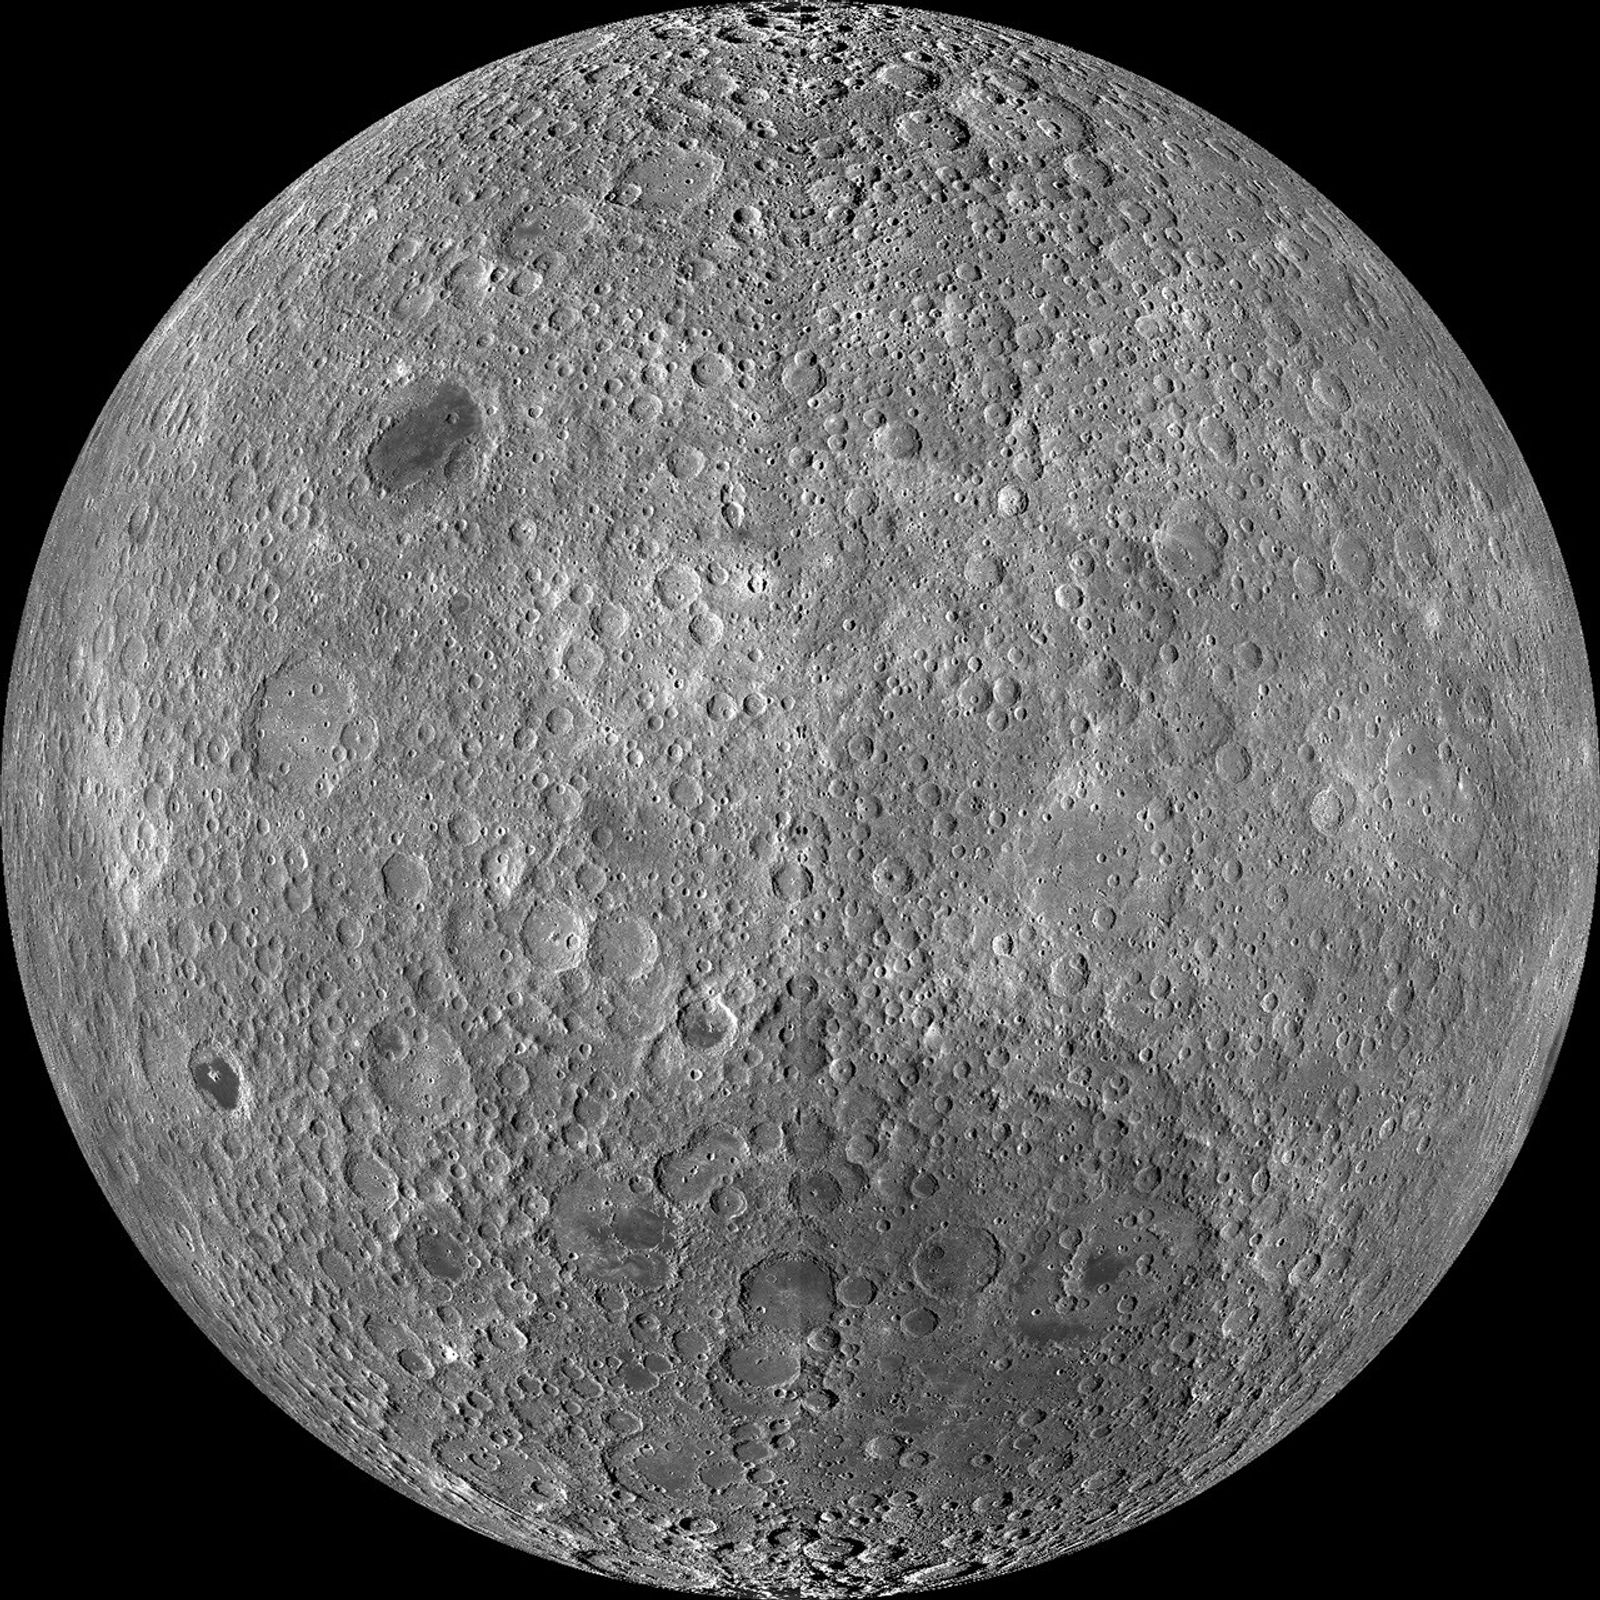
Lunar Farside
Explanation: Tidally locked in synchronous rotation, the Moon always presents its familiar nearside to denizens of planet Earth. From lunar orbit, the Moon’s farside can become familiar, though. In fact this sharp picture, a mosaic from the Lunar Reconnaissance Orbiter’s wide angle camera, is centered on the lunar farside. Part of a global mosaic of over 15,000 images acquired between November 2009 and February 2011, the highest resolution version shows features at a scale of 100 meters per pixel. Surprisingly, the rough and battered surface of the farside looks very different from the nearside covered with smooth dark lunar maria. A likely explanation is that the farside crust is thicker, making it harder for molten material from the interior to flow to the surface and form dark, smooth maria.
Tomorrow’s picture: Sunday’s Childe
| Date: | October 10, 2026 |
|---|---|
| Credit: | NASA / GSFC / Arizona State Univ. / Lunar Reconnaissance Orbiter |
| Authors & editors: | Jerry Bonnell, Cecilia Chirenti, Robert Nemiroff, Keighley Rockcliffe |
| A service of: |
ASD at NASA / GSFC, NASA Science Activation & Michigan Tech. U. |
NASA Seeks US Industry Plans for Commercial Space Stations
2026-10-09 18:11
NASA is advancing American leadership in space by taking the next step toward a future where commercial space stations lead the way in low Earth orbit. On Friday, the agency released its final Request for Proposals inviting industry to submit plans for the next generation of commercial space stations.
“In alignment with the President’s National Space Policy, NASA is committed to maintaining a sustained American presence in low Earth orbit long after the International Space Station retires,” said NASA Administrator Jared Isaacman. “We will continue to need a place to conduct research, develop technologies, train crews, and prepare for missions to the Moon and Mars. Commercial space stations may provide that capability while creating new opportunities for American industry and allowing NASA to concentrate more of our resources on the near-impossible missions ahead.”
Building on the agency’s Ignition event earlier this year, NASA regularly has engaged with private industry to shape the agency’s future direction in low Earth orbit. This included publishing two Requests for Information in March to gather industry’s perspective on low Earth orbit destinations and transportation. The agency also published a draft Request for Proposals in July, followed by an industry day and one-on-one meetings that allowed interested companies to review and comment on the planned acquisition approach.
“We’ve made it clear that NASA will never give up its presence in low Earth orbit,” said Isaacman. “Since Ignition, we have spent a lot of time listening to industry and working through what it will take to make this transition successful. The opportunity is significant, but the economics ultimately have to work. We want to see credible plans, strong technical execution, and companies prepared to invest in destinations that can serve NASA while developing additional customers and markets of their own.”
Proposals are due Tuesday, Dec. 8, with contract awards expected in spring 2027.
Under the solicitation, NASA outlines requirements for companies interested in designing, building, testing, certifying, and operating commercial low Earth orbit destinations capable of providing end-to-end destination and transportation services for human spaceflight use.
NASA intends to award firm-fixed-price, multi-award, indefinite-delivery/indefinite-quantity contracts supporting development, certification, and services for continued low Earth orbit research and exploration. This will allow NASA to select two or more contractors through early development, followed by a competitive task order for final design, test, and evaluation, as well as certification and services from one or more contractors.
Learn more about NASA’s missions on the agency’s website:
-end-
George Alderman / Joshua Finch
Headquarters, Washington
202-358-1600
george.c.alderman@nasa.gov / joshua.a.finch@nasa.gov
NASA Demonstrates Next-Generation Heat Shield Technologies
2026-10-09 16:59
4 min read
Preparations for Next Moonwalk Simulations Underway (and Underwater)
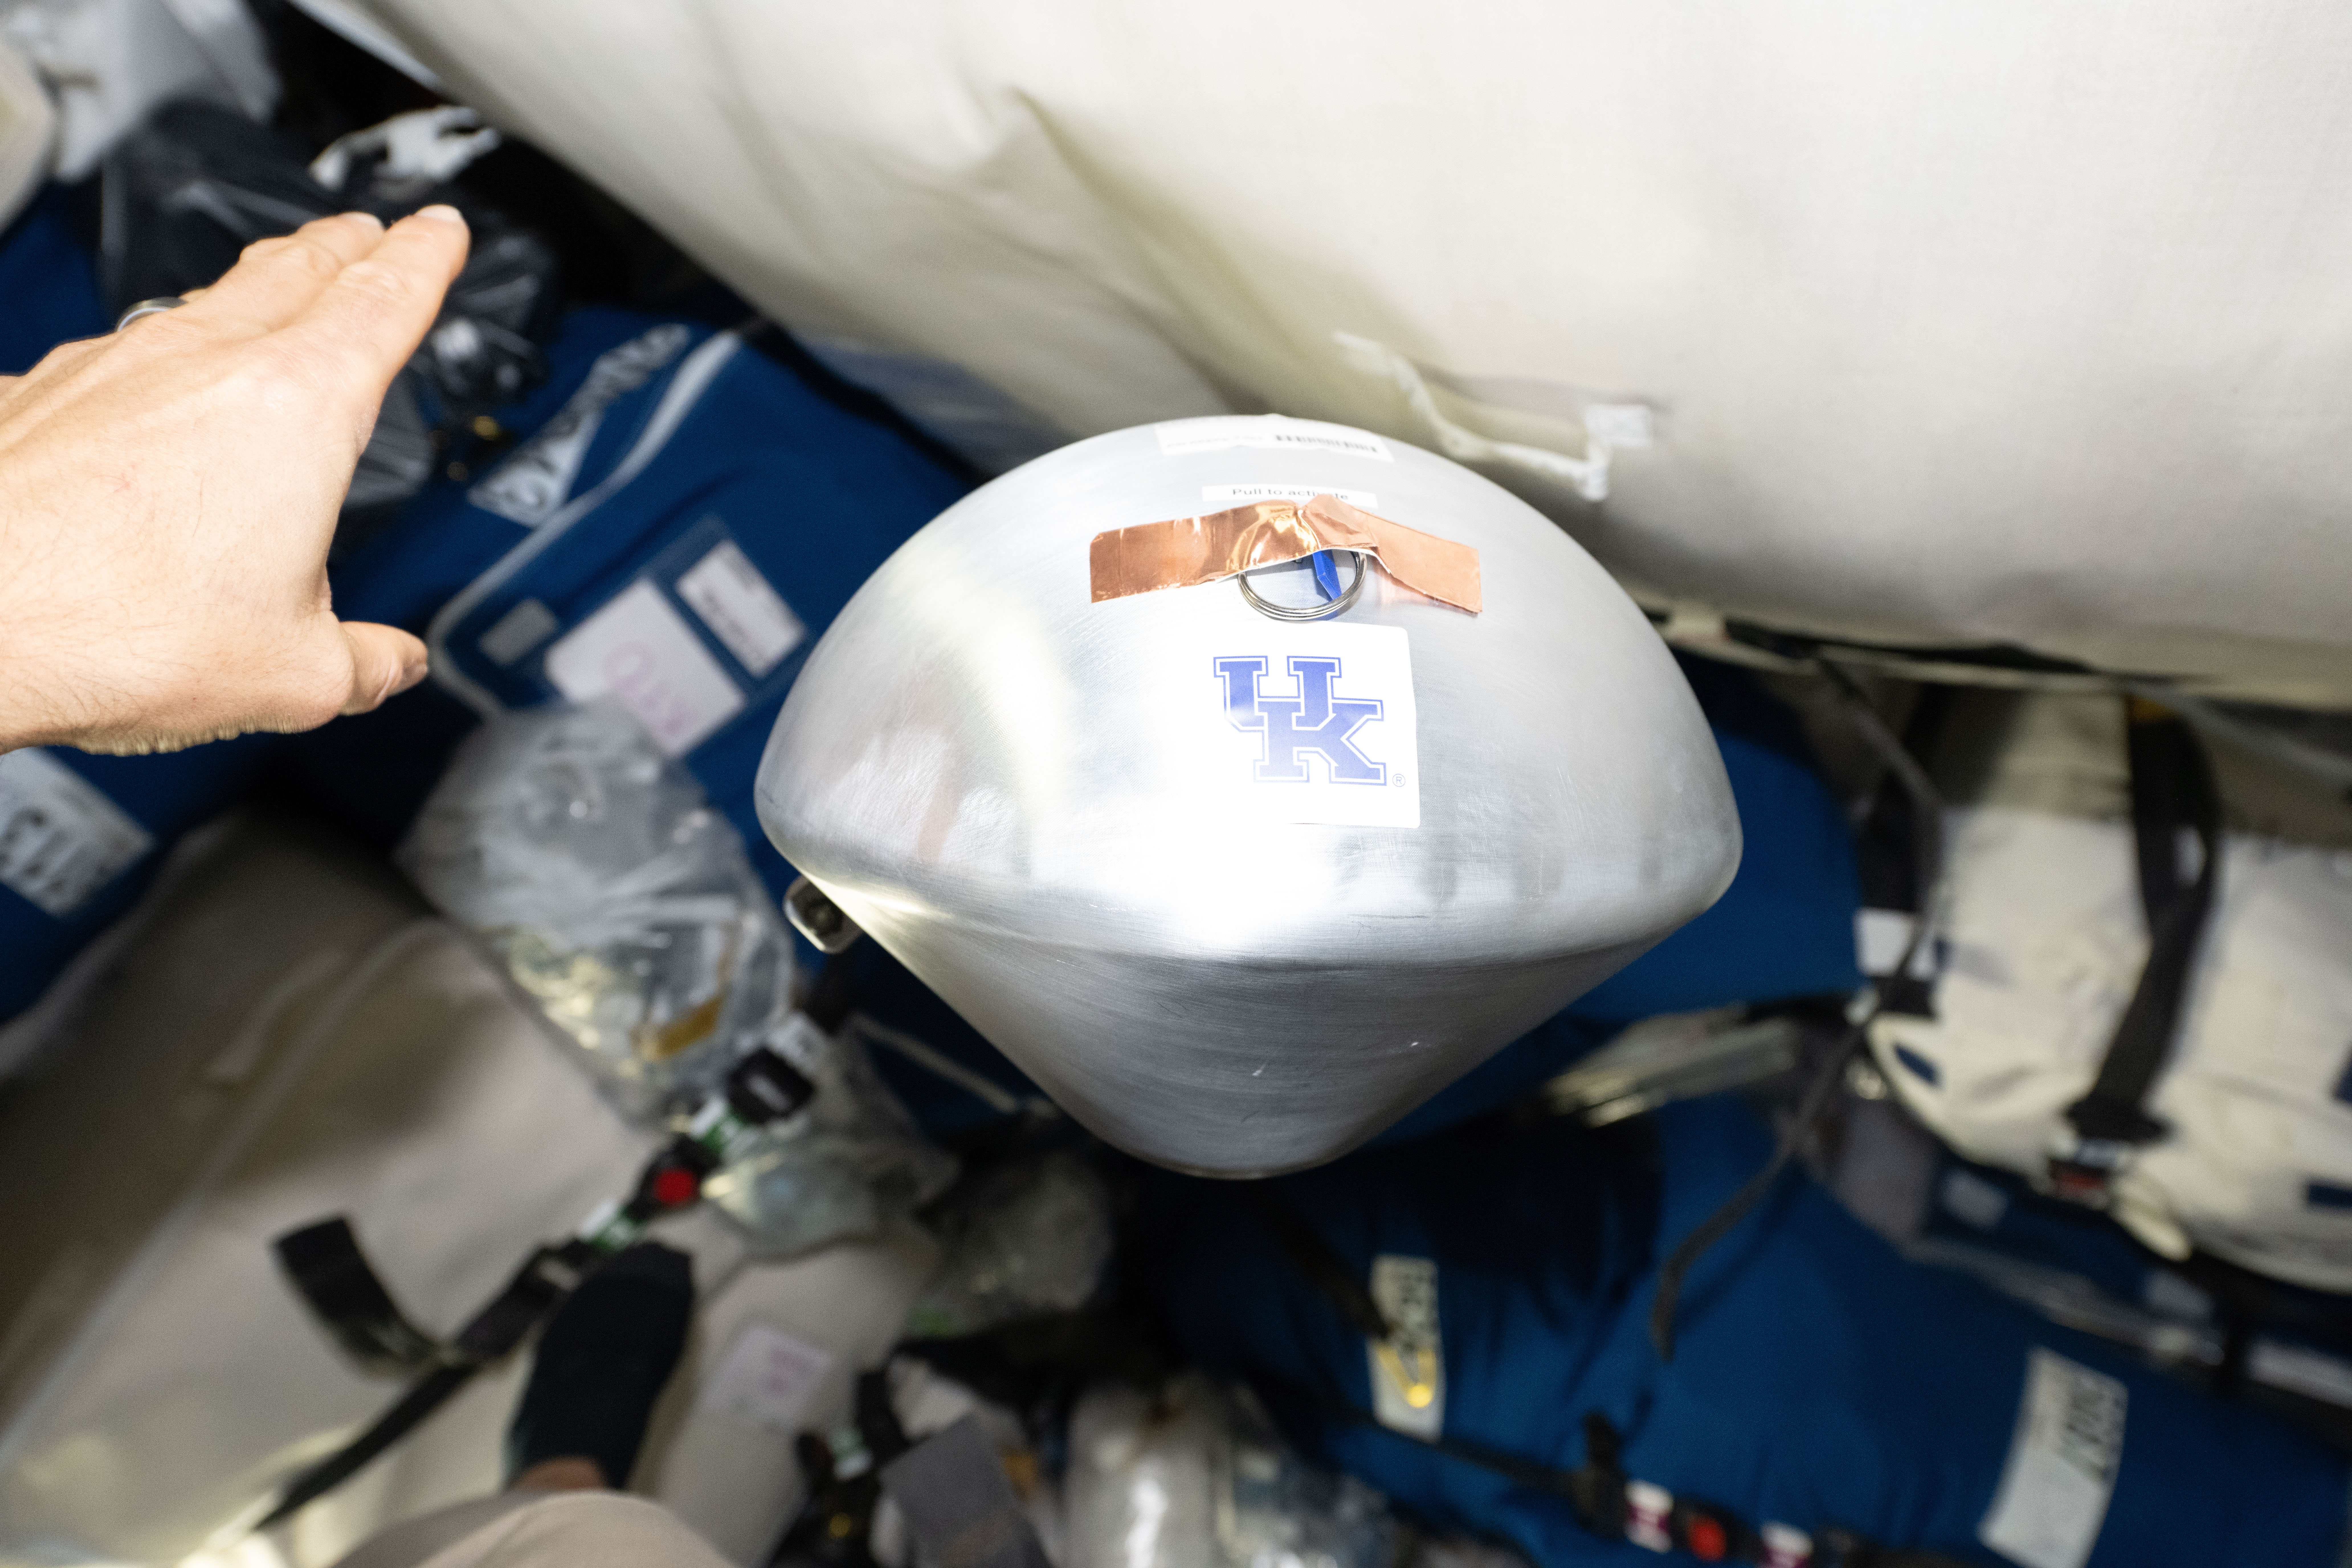
NASA is testing heat shields that can keep astronauts safe as they return from missions to the Moon and Mars in an unusual way: by taking out the trash.
When Northrop Grumman 24th cargo resupply mission for NASA undocked from the International Space Station, it carried a fleet of 12 small, experimental capsules designed to test the next generation of thermal protection materials that could serve as the foundation for future heat shields.
The experiment, called the Kentucky Reentry Probe Experiment (KREPE-3), is the third in a series of low-cost, high-impact missions that use the final moments of the cargo spacecraft’s lifespan to gather valuable data.
The experiment is a collaboration among the University of Kentucky, the state of Kentucky, NASA’s Established Program to Stimulate Competitive Research (EPSCoR), several NASA centers, and other federal and commercial partners.
“KREPE-3 is a great example of the goals of NASA’s EPSCoR program,” said David Berger, EPSCoR program manager at NASA’s Headquarters in Washington. “We are supporting the next generation of scientists and engineers as they develop unique projects that benefit their education and NASA’s mission goals.”
Trash to treasure
Before the mission’s Cygnus XL spacecraft departed the station, astronauts packed it with waste and activated the 12 small capsules carried inside. Designed by University of Kentucky students, the capsules include sensors that will measure temperature, pressure, motion, magnetic field, and light during re-entry.
As the vehicle harmlessly breaks apart in Earth’s atmosphere on its planned route, the capsules will eject and begin collecting data on how each set of experimental heat shield materials performs. Satellite signals will transfer live data to researchers, offering insights into how larger heat shields could protect future cargo or crew.
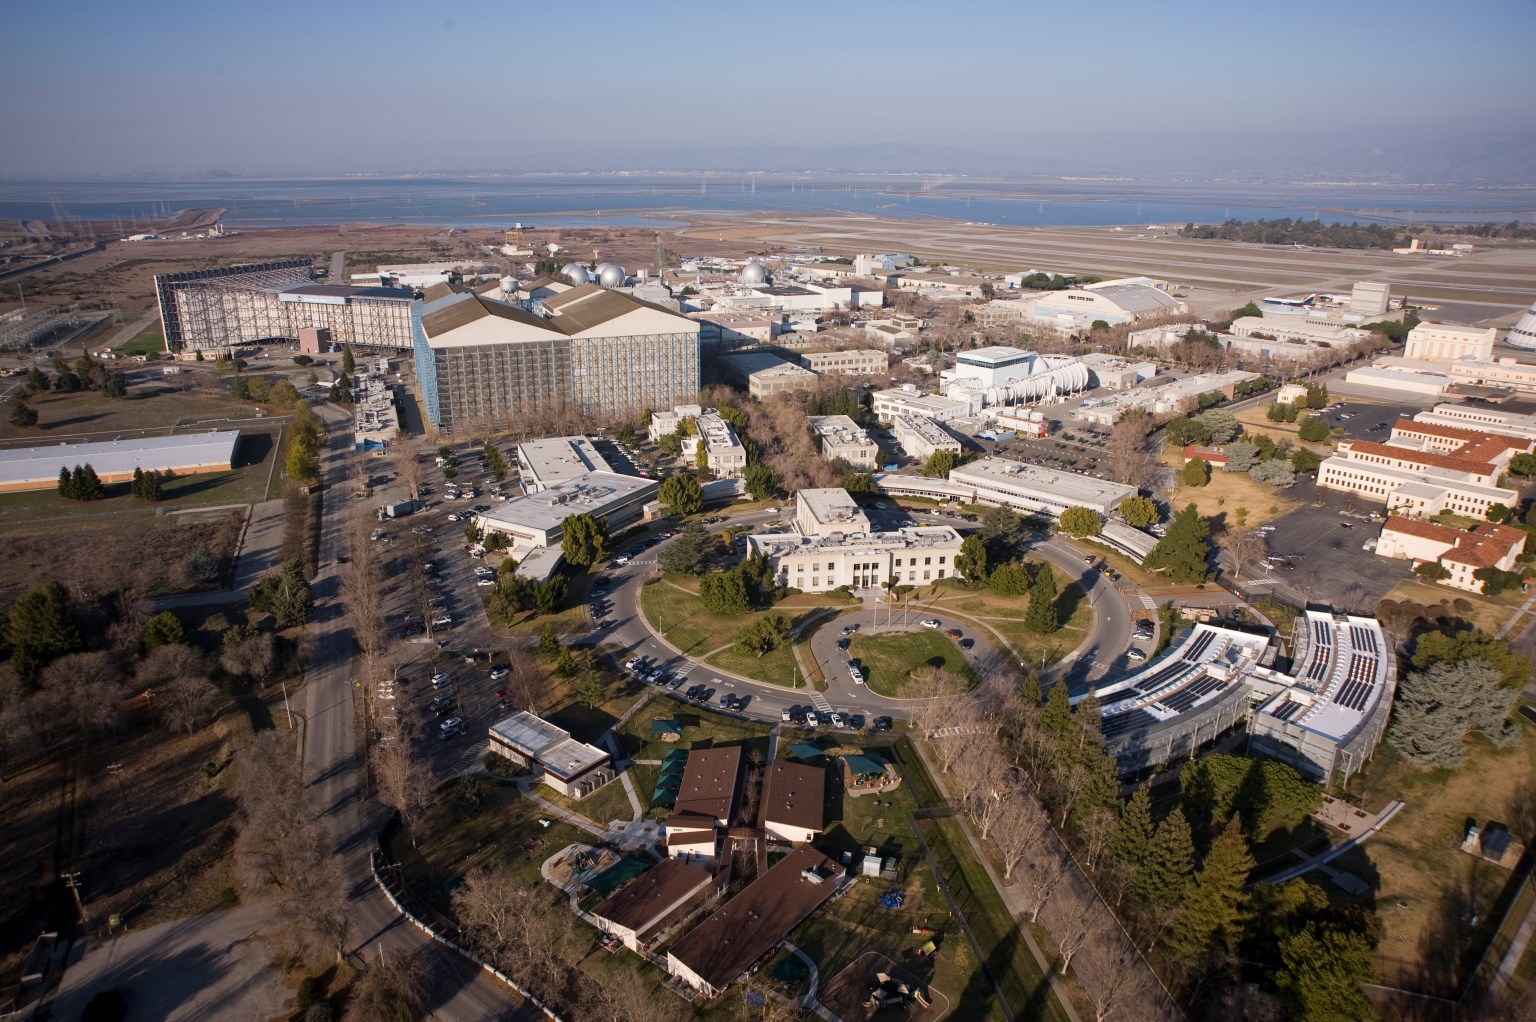
“It’s a smart way to get flight data on materials that are still in development,” said Keith Peterson, a materials engineer at NASA’s Ames Research Center in California’s Silicon Valley. “We’re essentially hitching a ride on a vehicle that’s already coming back to Earth.”
Heating up innovation
The capsules will carry a variety of thermal protective components, including proven technology such as the ceramic tile material used on the space shuttle. Others will test new options, such as a 3D-printed heat shield from the Additive Manufacturing of Thermal Protective Systems project developed at NASA Johnson and Oak Ridge National Laboratory.
Researchers at NASA Ames are contributing several materials to KREPE-3, including two capsules that will fly a next-generation family of protective coverings known as Materials Engineered for Re-entry using Innovative Needling Operations (MERINO). Made from layers of carbon and phenolic fibers stitched together like felt, the materials are more flexible, faster to produce, and less expensive than traditional protective substances – making them promising candidates for Mars missions. Thanks to Mars’ thinner atmosphere, missions to land on the Red Planet involve lower heat loads and allow for lighter protection.
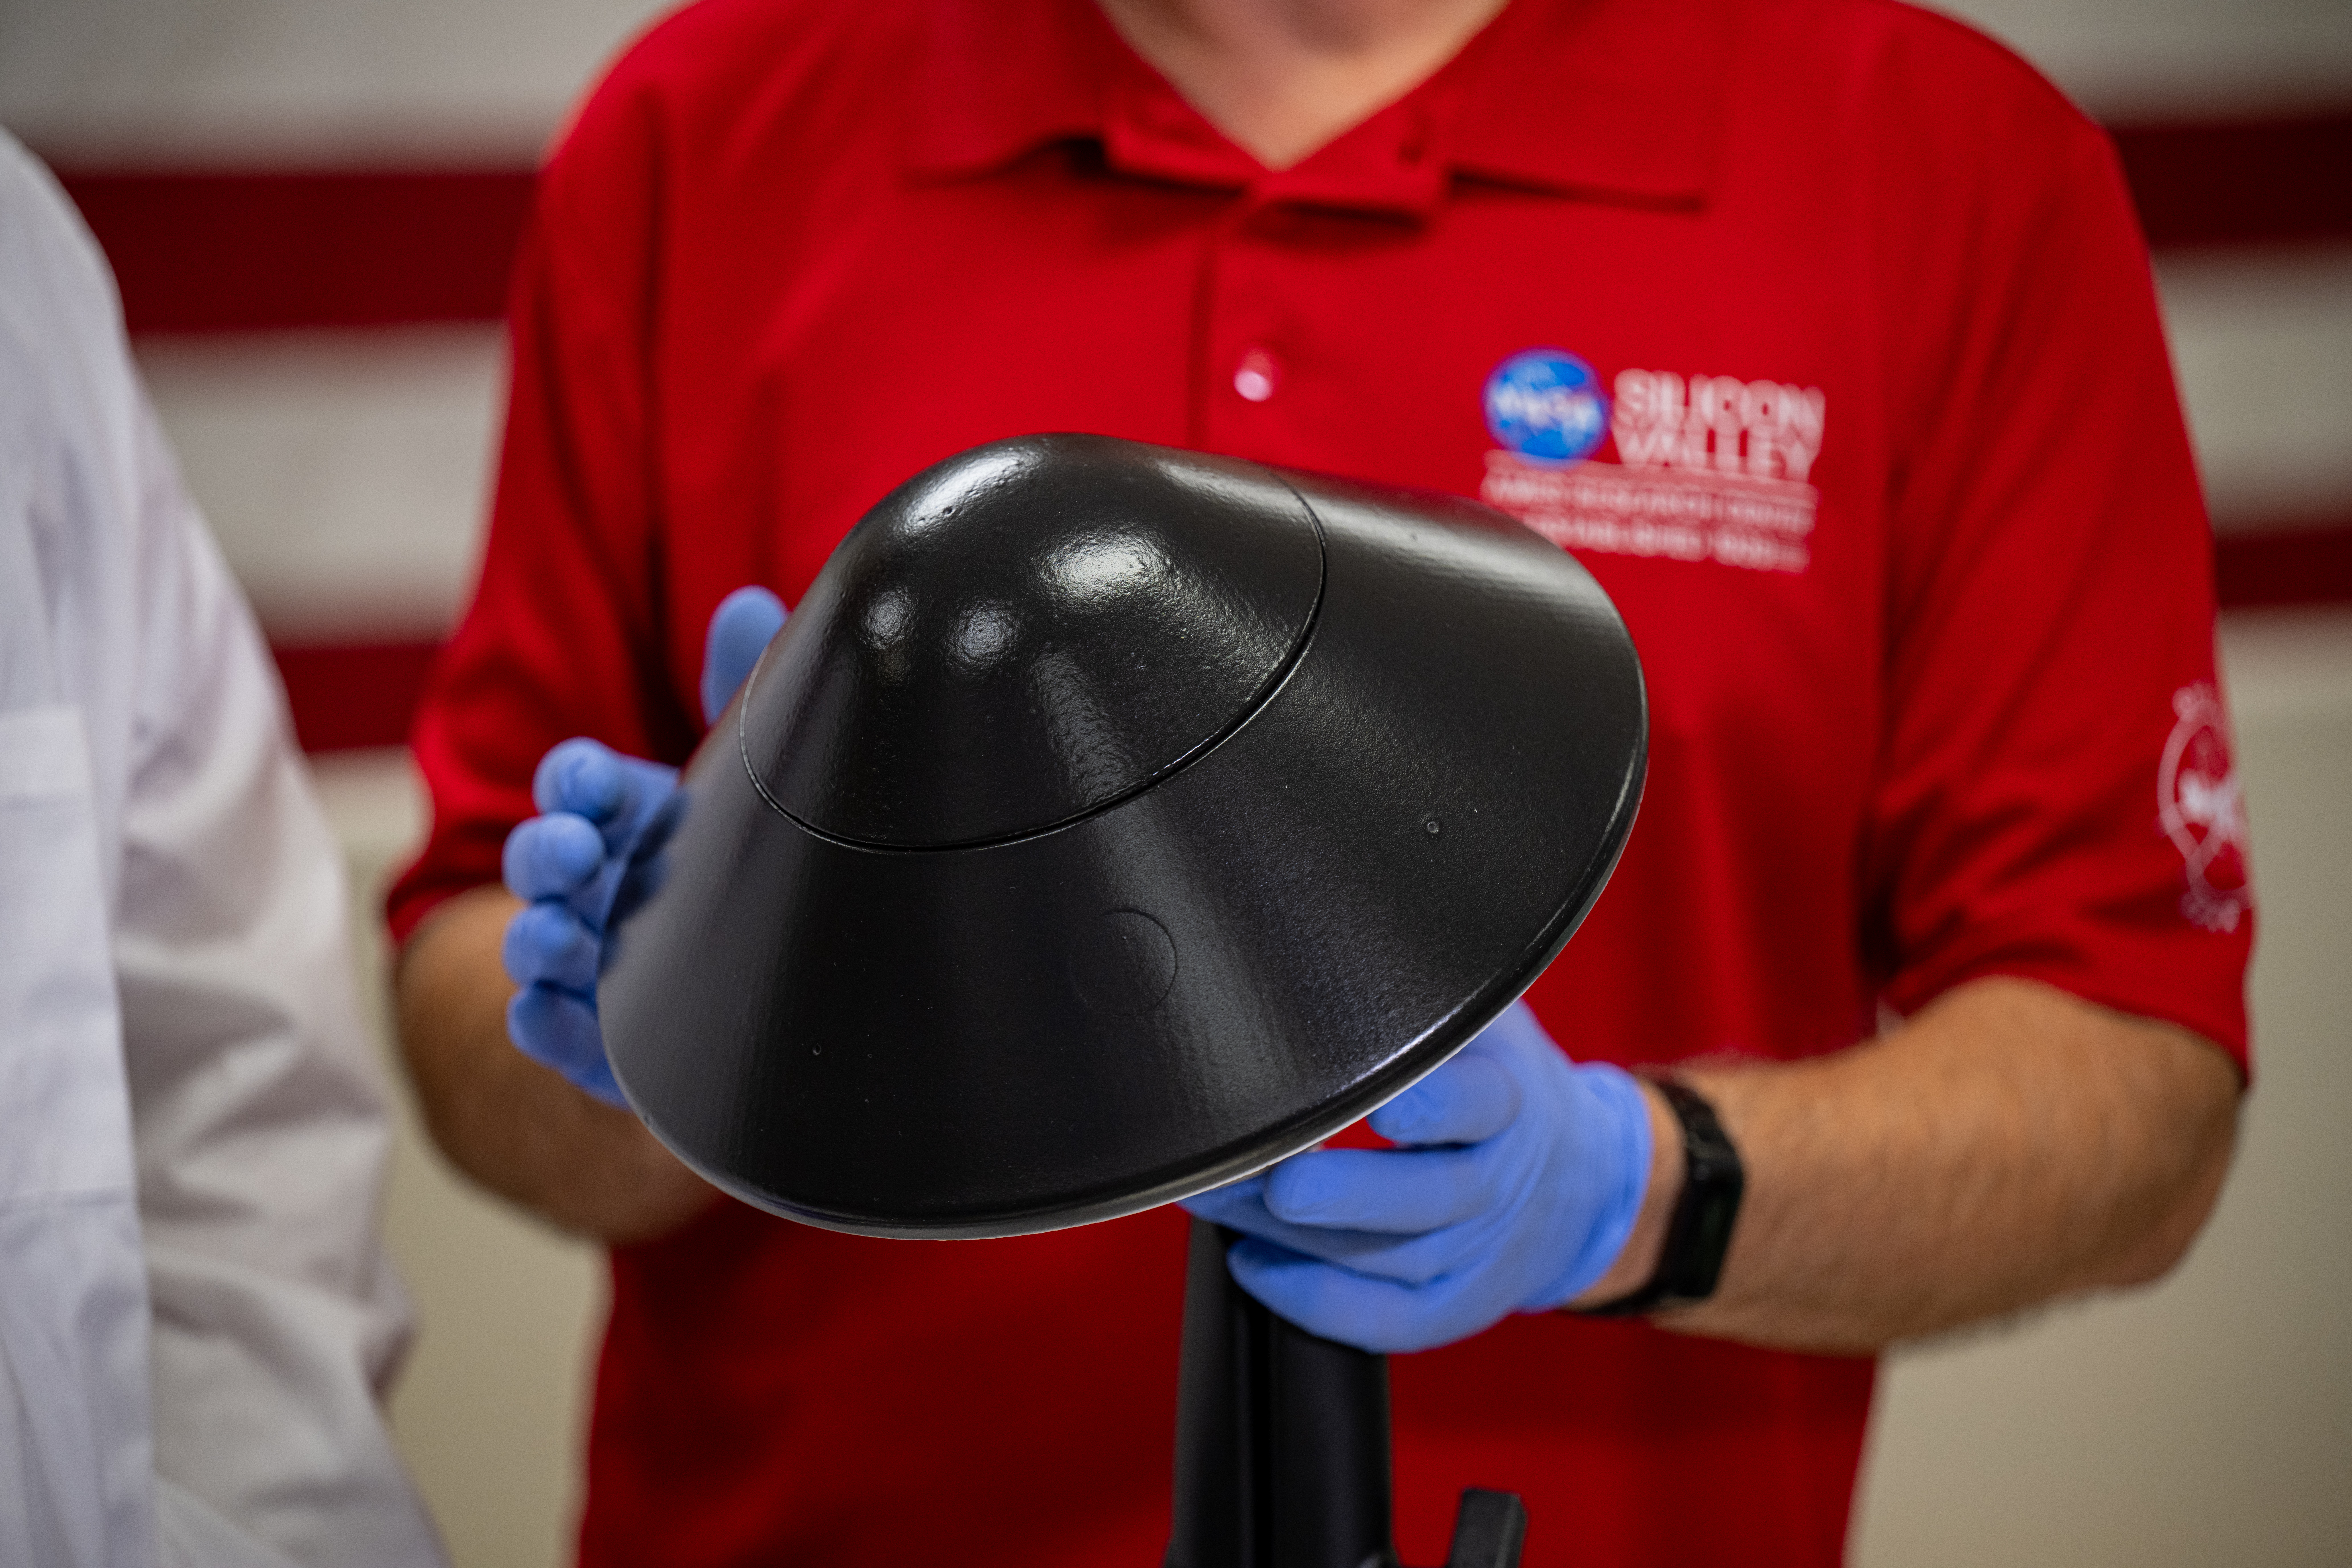
A third capsule will combine those protective coverings with other elements. The Kentucky Instrumented Conical Hypersonic Experiment will utilize a dual-cone shape. It combines a tungsten tip attached to a cone layered with carbon and hear-resistant plastic fibers, and an aft cone wrapped in MERINO. This unique design will validate computer models against real-world data.
Another capsule is shaped like the protective aeroshell that will protect NASA’s upcoming mission, Dragonfly, as it arrives at Saturn’s moon, Titan, and will test the dynamic stability of the design. It is covered in Phenolic Impregnated Carbon Ablator, a material developed at NASA Ames that has applications for commercial vehicles and flew on NASA’s Stardust, Mars Science Laboratory, and Mars 2020 missions.
One capsule will test a deployable heat shield called Adaptable Deployable Entry and Placement Technology, which is shaped like an umbrella to increase surface area and slow descent. At full scale, Adaptable Deployable Entry design could be folded, making it ideal for deploying payloads that are larger than the rockets that launch them into flight.
While some capsules are testing new materials to carry missions to Mars, others are testing new shapes and designs that will further research and understanding of computer modeling and sensor design — technologies that could open doors to another generation of re-entry design innovation.
Additional capsules developed by domestic and international partners will test a variety of known and new materials, including a heat flux sensor developed at the University of Stuttgart in Germany, that will help researchers measure how heat moves across a surface during re-entry.
“We’re pushing the boundaries of what heat shields can do,” said Peterson. “And we’re testing them in a way that’s fast, affordable, and incredibly effective.”
Share
Details
Related Terms
Explore More


TechCrunch - Latest
Microsoft’s Satya Nadella says AI models need an ‘emergency brake’
2026-10-10 21:47
Apple discloses deal to hire team and license tech from personalized podcast startup Huxe
2026-10-10 19:50
Petra Power looks to modernize energy for data centers and defense vehicles
2026-10-10 17:00
Cloudflare acquires Deno to improve its Workers programming model
2026-10-10 16:25
3 days to TechCrunch Disrupt 2026: Meet the startups before they hit mainstream
2026-10-10 15:00