📰 Trending Topics
Google News - Trending
Google News - Technology
Apple Product Launch Announced for October 13: 'Welcome Home' - MacRumors
2026-10-08 16:04
- Apple Product Launch Announced for October 13: 'Welcome Home' MacRumors
- I’m Way Too Excited for Apple’s Home Event and How It Will Level Up My Siri Experience CNET
- Apple Announces Oct. 13 Smart Home Product Launch in New York Bloomberg.com
- Apple's October 13 Launch: What's Coming MacRumors
- 4 big announcements coming at Apple’s Welcome Home event Macworld
A week with Googlebooks: four notes from our testing so far - The Verge
2026-10-09 13:36
- A week with Googlebooks: four notes from our testing so far The Verge
- There is Another ⭐ Thurrott.com
- I thought the Acer Googlebook's Magic Pointer would annoy me. It didn't PCWorld
- 5 Reasons Why Android Phone Users Will Want A Googlebook BGR
- Dell Technologies Introduces XPS Googlebook: The First XPS Laptop Built for Gemini Intelligence Investor Relations | Dell Technologies
Microsoft's Surface Laptop Ultra is an AI supercomputer dressed as a laptop - Mashable
2026-10-09 14:28
- Microsoft's Surface Laptop Ultra is an AI supercomputer dressed as a laptop Mashable
- Building Windows for hybrid intelligence Windows Blog
- Microsoft to sell $2,599 Surface Laptop Ultra containing Nvidia AI chip CNBC
- NVIDIA, Microsoft Kick Off a New Beginning for Windows PCs With RTX Spark and AI Agents NVIDIA Blog
- Microsoft event debuts new AI-friendly hardware and Windows changes Ars Technica
Huawei Mate 90 series wallpapers are now up for download - Huawei Central
2026-10-09 04:26
- Huawei Mate 90 series wallpapers are now up for download Huawei Central
- A phone brand you'd forgotten just dropped the most incredible camera phone I've ever seen Digital Camera World
- Huawei Pivots Back to Smartphones as EV Dreams Stall The Tech Buzz
- Grab Wallpapers From One of the More Interesting New Flagship Phones Android Headlines
- Huawei’s Kirin 9050 Pro Hits 5,381 in Geekbench Leak [2026] shattered.io
PhoneBot gives old smartphones a new job on two legs - Tech Xplore
2026-10-08 20:20
NASA - Breaking News
Cosmic House of Mirrors
2026-10-09 13:57

Galaxies warp and multiply as if in a house of mirrors in this image from NASA’s James Webb Space Telescope released on Sept. 29, 2026.
The brilliant golden galaxies seen here are part of a galaxy cluster called MACS J0454.1-0300. The orange galaxies bunched together on one side of the image, however, are not actually part of the cluster, but rather galaxies much farther away whose light has been bent and magnified by gravitational lensing. This phenomenon occurs when the enormous mass of a foreground object such as a galaxy cluster bends and magnifies the light from a more distant object in the background.
Learn more about this galaxy cluster.
Image credit: ESA/Webb, NASA & CSA, L. Furtak, S. Fujimoto
APOD: 2026 October 9 – Stickney Crater
2026-10-09 04:05
APOD
Astronomy Picture of the Day
Discover the cosmos! Each day a different image or photograph of our fascinating universe is featured, along with a brief explanation written by a professional astronomer.
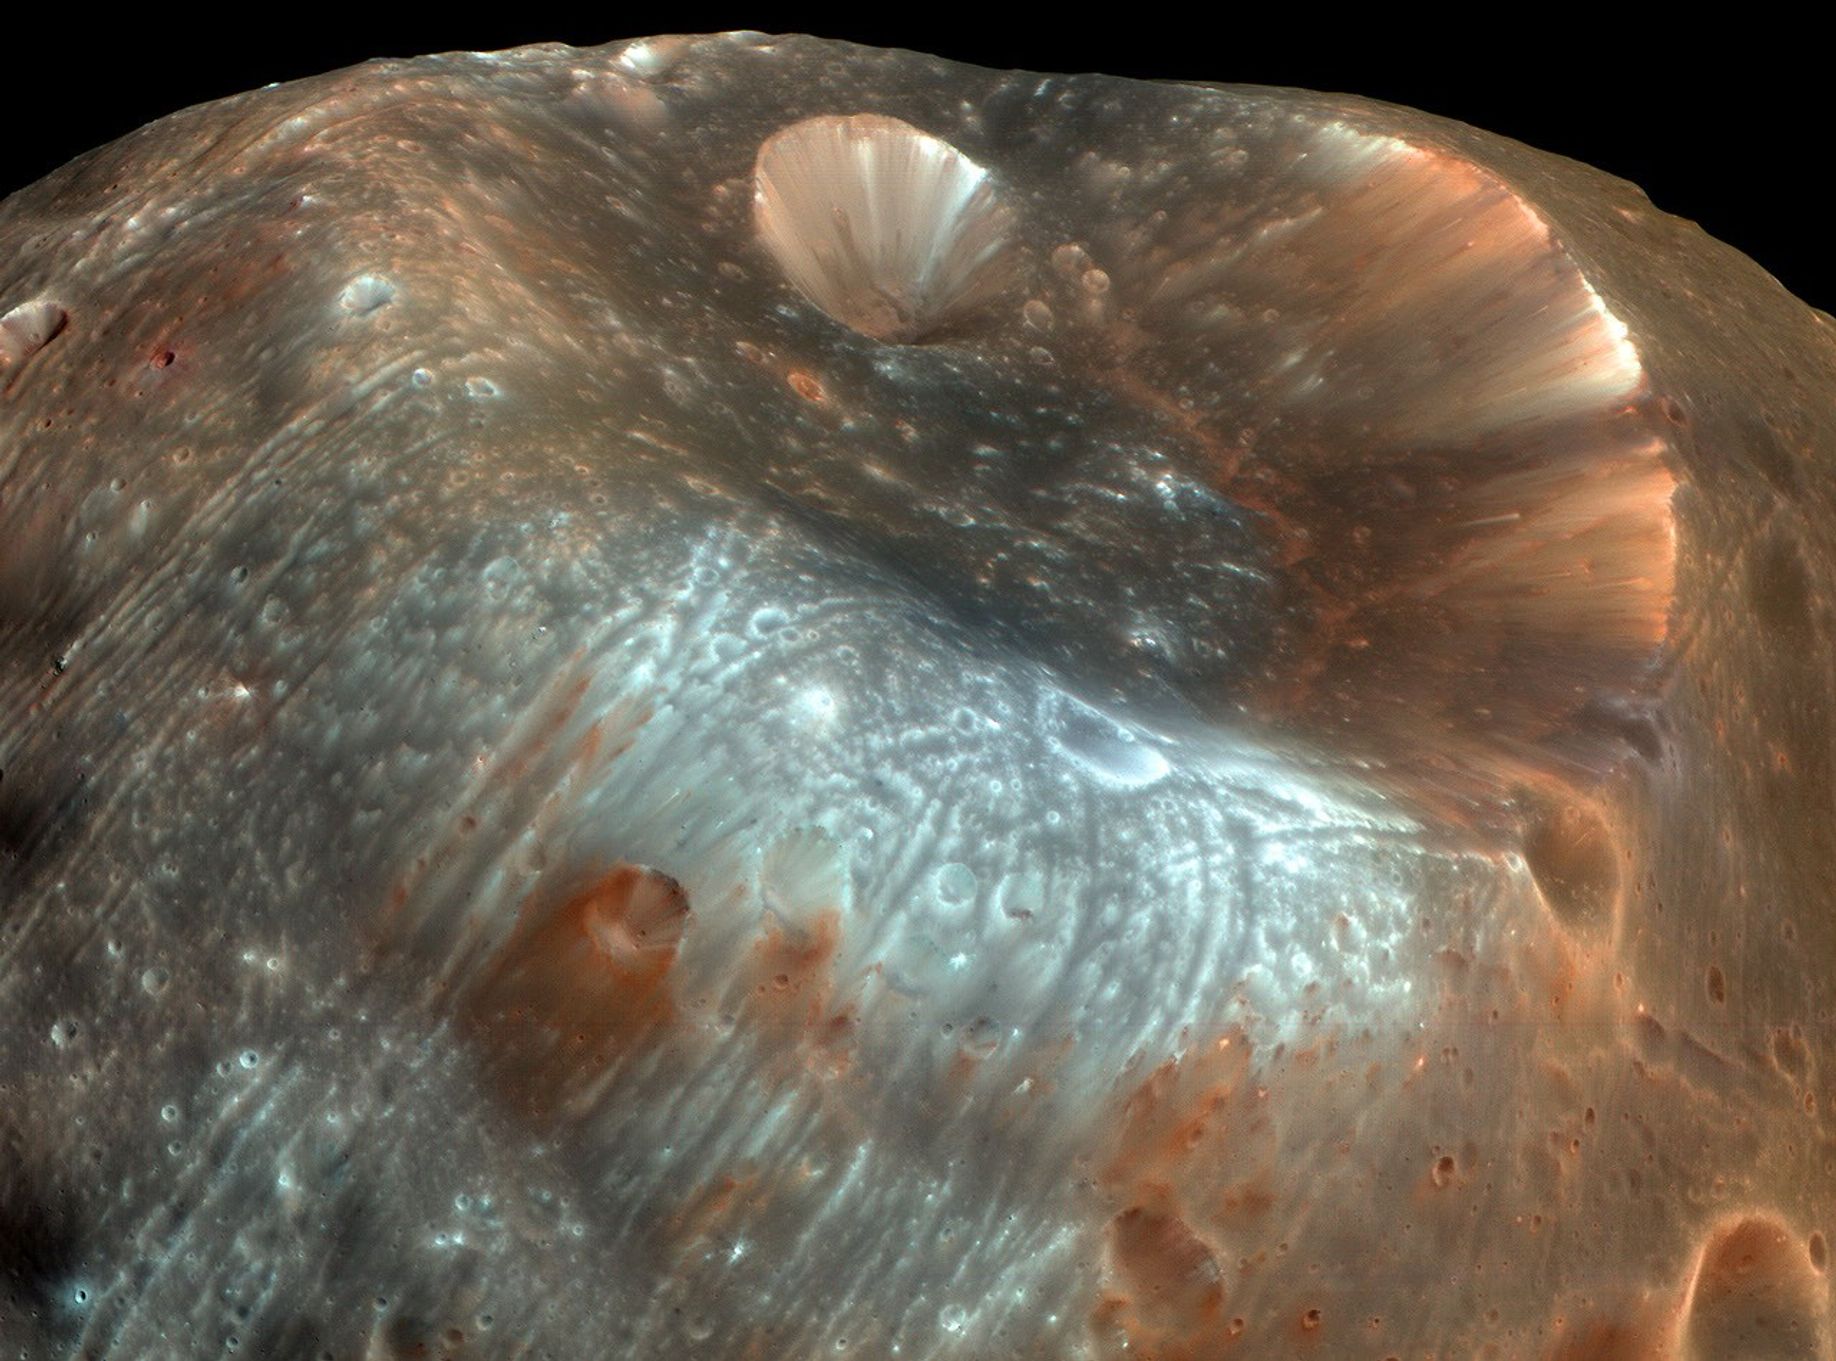
Stickney Crater
Explanation: Stickney Crater, the largest crater on the martian moon Phobos, is named for Chloe Angeline Stickney Hall, mathematician and wife of astronomer Asaph Hall. Asaph Hall discovered both the Red Planet’s moons in 1877. Over 9 kilometers across, Stickney is nearly half the diameter of Phobos itself, so large that the impact that blasted out the crater likely came close to shattering the tiny moon. This enhanced-color image of Stickney and surroundings was recorded by the HiRISE camera onboard the Mars Reconnaissance Orbiter as it passed within some six thousand kilometers of Phobos in March of 2008. Even though the surface gravity of asteroid-like Phobos is less than 1/1000th Earth’s gravity, streaks suggest loose material slid down inside the crater walls over time. Light bluish regions near the crater’s rim could indicate a relatively freshly exposed surface. The origin of the curious grooves along the surface is mysterious but may be related to tidal stresses experienced by close-orbiting Phobos or the crater-forming impact itself.
Tomorrow’s picture: farside
| Date: | October 9, 2026 |
|---|---|
| Credit: | HiRISE, MRO, LPL (U. Arizona), NASA |
| Authors & editors: | Jerry Bonnell, Cecilia Chirenti, Robert Nemiroff, Keighley Rockcliffe |
| A service of: |
ASD at NASA / GSFC, NASA Science Activation & Michigan Tech. U. |
Floodwaters Overwhelm Thailand
2026-10-09 04:01

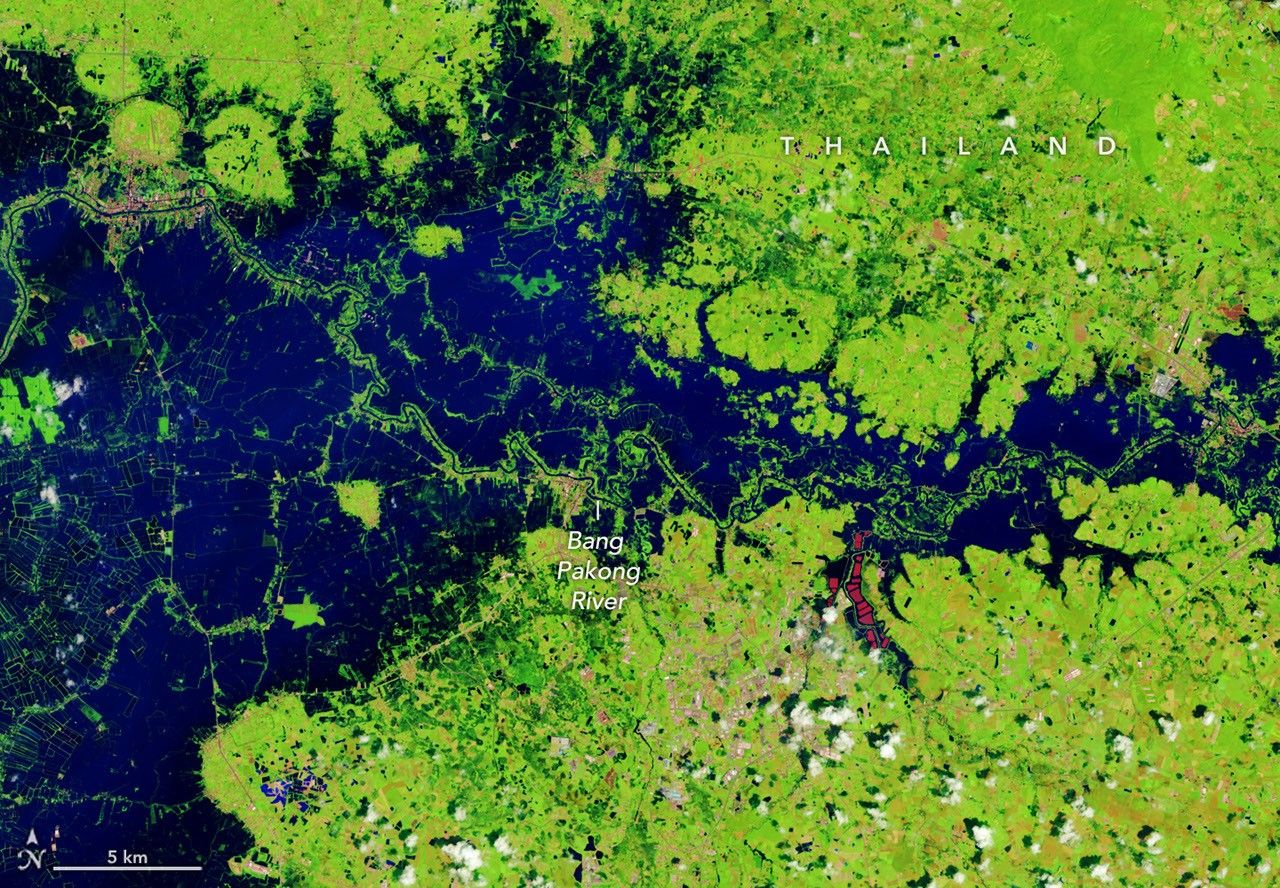

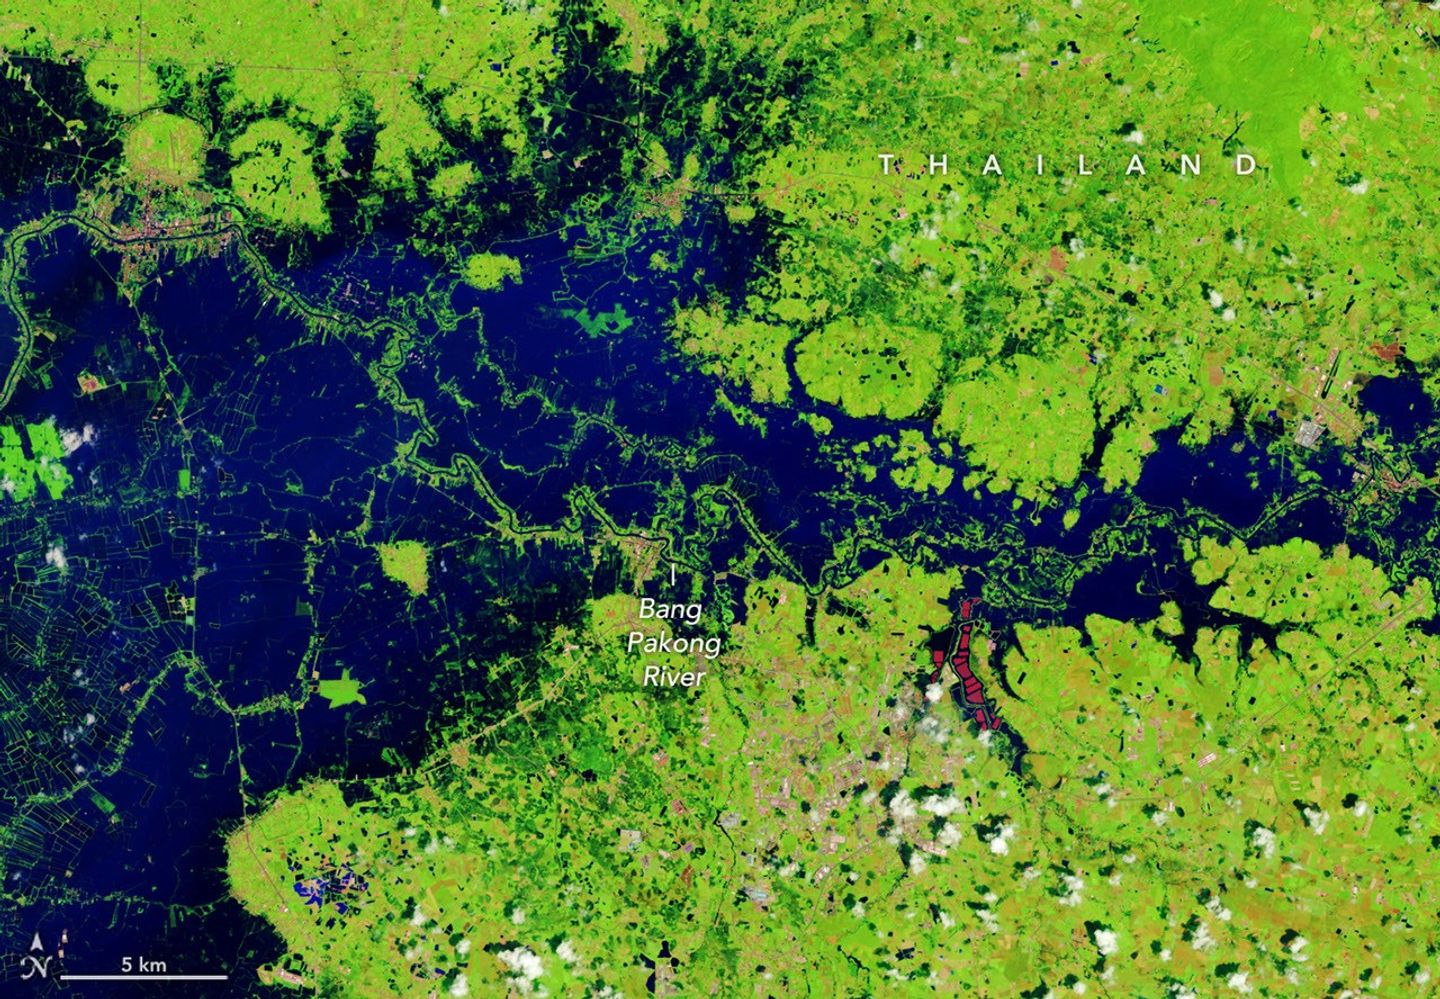
October 7, 2025
October 2, 2026
September falls in the heart of the monsoon season in Thailand, where cities and towns are accustomed to the afternoon rains and thunderstorms that frequently roll through. But throughout late September and early October 2026, persistent heavy rains punctuated by intense downpours left low-lying areas across the country in Southeast Asia under sustained flooding.
Prachin Buri province was among the areas where flooding was widespread. The right image above shows land along the Bang Pakong River and nearby agricultural areas and aquaculture facilities inundated on October 2, 2026. The left image shows the same area at the same time of year in 2025. Acquired with NASA-USGS Landsat satellites, the images are false-color to better distinguish water from vegetation, developed land, and other surfaces. The bright red shapes are floating solar arrays.
Some of the flooding likely stemmed from a low-pressure system that stalled over the area for several days in late September. Stoked by moisture and energy from the warm Gulf of Thailand nearby, the system delivered especially intense rains to the region. About 100 kilometers (60 miles) to the west, Bangkok received nearly 300 millimeters (11.8 inches) of rain over a 48-hour period, according to news reports, close to the average monthly rainfall total for September of 344 millimeters (13.5 inches).
Since mid-September, flooding has occurred in 50 provinces across the country, affecting over 4 million people and causing dozens of deaths, according to the International Federation of Red Cross and Red Crescent Societies. Government agencies estimate about 270,000 hectares (670,000 acres) of farmland, including rice fields and fruit orchards, have been damaged.
NASA Earth Observatory images by Lauren Dauphin, using Landsat data from the U.S. Geological Survey. Story by Lindsey Doermann.


References & Resources
- ABC News (2026, September 28) Residents brave floodwater for supplies after Bangkok inundated. Accessed October 7, 2026.
- The Conversation (2026, October 5) As the planet warms, cities like Bangkok could be increasingly inundated by deadly floods. Accessed October 7, 2026.
- The Nation (2026, October 7) Thailand floods hit 1.7m rai including over 26,000 rai of orchards. Accessed October 7, 2026.
- ReliefWeb (2026, October 6) THA: Flood – 09-2026 – Heavy rainfall caused flooding #3. Accessed October 7, 2026.
You may also be interested in:
Stay up-to-date with the latest content from NASA as we explore the universe and discover more about our home planet.

After days of torrential rain, the river rose to record-breaking levels in parts of Nepal and India.

Surrounded by wetlands, Manitoba’s northernmost farmland near The Pas turns from green to brown over the 2026 growing season.

It was here the founders shaped the future of American government.




NASA Briefing to Highlight Contributions to Martian Moons Mission
2026-10-08 20:22
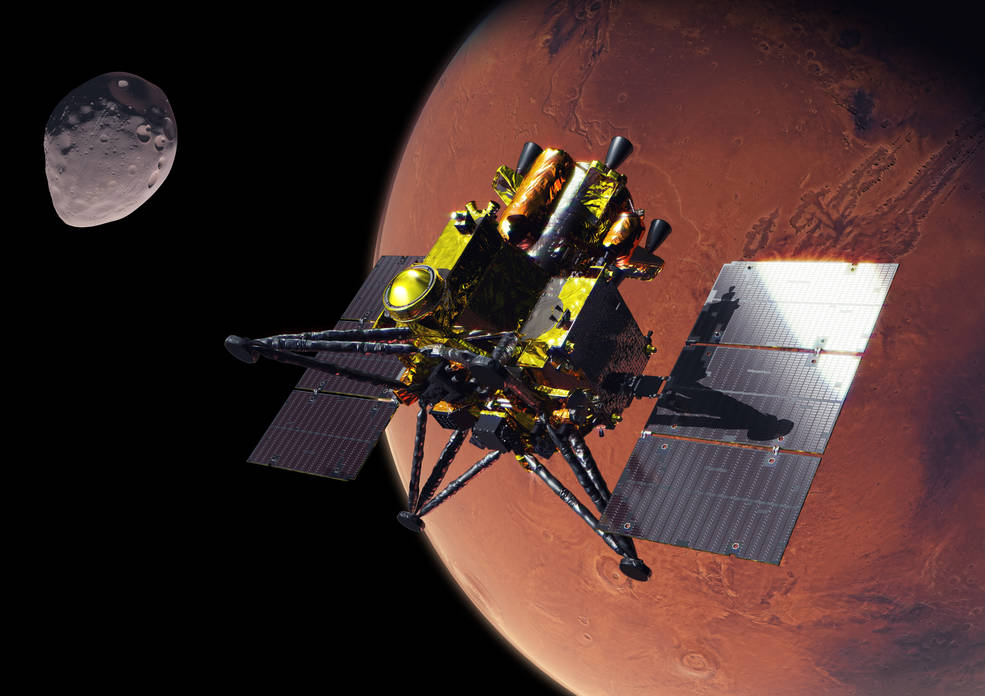
Media are invited to join NASA for a media teleconference at 4 p.m. EDT, Thursday, Oct. 15, to preview the agency’s contributions to JAXA’s (Japan Aerospace Exploration Agency) Martian Moons eXploration (MMX) mission. The mission is scheduled to launch from JAXA’s Tanegashima Space Center in Japan on Monday, Oct. 19 EDT (Tuesday, Oct. 20 JST).
Audio of the media teleconference will stream on the agency’s website at:
Participants in the briefing, who will provide an overview of the mission and NASA’s contributions, include:
- Lindsay Hays, acting director, Planetary Science Division, NASA Headquarters in Washington
- Tom Statler, MMX program executive and scientist, Planetary Science Division, NASA Headquarters
- David Lawrence, MEGANE (Mars-moon Exploration with Gamma-rays and Neutrons) principal investigator, Johns Hopkins Applied Physics Laboratory
- Kris Zacny, vice president, Blue Origin’s Honeybee Robotics
Media interested in participating by phone must RSVP no later than two hours prior to the start of the teleconference to Molly Wasser at molly.l.wasser@nasa.gov. A copy of NASA’s media accreditation policy is online.
The MMX spacecraft will arrive at Mars in August 2027 to begin its survey of the Red Planet’s two moons, Phobos and Deimos. After surveying Phobos in detail, the spacecraft will collect a sample of the moon’s surface no earlier than December 2028 and deliver it to Earth in 2031. NASA’s contributions to the mission include the MEGANE gamma-ray and neutron spectrometer, the spacecraft’s surface sampler mechanism, and communications and navigation support from the agency’s Deep Space Network, as well as funding United States scientists participating on the MMX science team.
The MEGANE instrument was developed by Johns Hopkins Applied Physics Laboratory. Honeybee Robotics, a Blue Origin company, developed the spacecraft’s pneumatic sampler mechanism. NASA’s contributions to the MMX mission were funded by the agency’s Discovery Program, which provides frequent flight opportunities for high-value, focused planetary science investigations. The Discovery Program is managed by NASA’s Marshall Space Flight Center in Huntsville, Alabama, for the agency’s Science Mission Directorate in Washington.
For more information about the MMX mission, visit:
https://science.nasa.gov/mission/mmx/
-end-
Karen Fox / Alana Johnson
Headquarters, Washington
240-285-5155 / 202-672-4780
karen.c.fox@nasa.gov / alana.r.johnson@nasa.gov
NASA Announces Bold Science Initiatives for America’s Golden Age Summit
2026-10-08 19:40
Editor’s note: This release was updated Oct. 8, 2026 with the formal name of the summit.
NASA is launching two new science and technology initiatives to deepen scientific understanding and accelerate the innovation that will shape America’s future in space.
The initiatives are announced in conjunction with the White House Office of Science and Technology Policy’s (OSTP) “Science: A Golden Age Summit” in Washington on Thursday with top U.S. agency leaders. The programs reflect NASA’s commitment to pioneering research and transformative technologies and advancing the Trump Administration’s vision as outlined in the July report to the President, Science: A New Golden Age. One focuses on peer review and the other on fellowship researchers.
“NASA has a proud history of pursuing bold ideas and achieving the near impossible,” said NASA Administrator Jared Isaacman. “Under President Trump’s leadership, we are building on that legacy by creating new opportunities for great science, experimenting with how we evaluate and accelerate the best ideas, and investing in the next generation of researchers through the Genesis Mission Fellowships. We are entering a new Golden Age of American innovation and discovery, and NASA will be at the forefront.”
During a fireside chat, Isaacman and Michael Kratsios, assistant to the President for science and technology and director of OSTP, will discuss the following:
- Establishing a coordinated metascience initiative within NASA’s Science Mission Directorate to strengthen the reliability, efficiency, transparency, and overall productivity of the agency’s scientific practices. As part of this effort, NASA is expanding the agency’s use of dual anonymous peer review to ensure proposals are evaluated solely on their intrinsic scientific merit. This approach enhances fairness and supports innovative and unconventional research ideas. Started as a pilot program during the first Trump Administration, this initiative has helped position NASA as a leader in advancing best practices in scientific review.
- NASA will support 10 Genesis Mission Fellows, who are accelerated doctoral students with dual competencies in super intelligence (SI) and science or engineering. Fellows will work directly on NASA mission areas and conduct research at NASA laboratories, advancing SI-enabled scientific discovery. The fellowships will be based on NASA’s successful Future Investigators in NASA Earth and Space Science and Technology program.
NASA leads the nation in space exploration, scientific discovery, and technological innovation. Through these new initiatives, NASA will continue to inspire the world and drive progress in science and technology.
Learn more about NASA science at:
-end-
Camille Gallo / Elizabeth Shaw
Headquarters, Washington
202-358-1600
camille.m.gallo@nasa.gov / elizabeth.a.shaw@nasa.gov
TechCrunch - Latest
A16z’s Olivia Moore on the state of consumer AI
2026-10-09 15:43
Automattic loses its interim CFO just weeks after boardroom shakeup
2026-10-09 15:02
Beyond TechCrunch Disrupt 2026: The Side Events, Parties & Networking You Can’t Miss
2026-10-09 14:42
TechCrunch Disrupt 2026: Gamma’s Grant Lee, Engine’s Elia Wallen, and GV’s Crystal Huang on landing your first 1,000 customers
2026-10-09 14:30
TechCrunch Disrupt 2026 starts in 4 days — lock in your pass savings of up to $100 before prices rise
2026-10-09 14:00


