📰 Trending Topics
Google News - Trending
Google News - Technology
Meta braces for Android XR, opens Ray-Ban Display glasses to third-party apps - 9to5Google
2026-05-15 14:30
- Meta braces for Android XR, opens Ray-Ban Display glasses to third-party apps 9to5Google
- Meta brings virtual writing to everyone with Meta Ray-Ban Display glasses The Verge
- Six Months of Meta Ray-Ban Display meta.com
- AI takes Meta's Ray-Ban Display glasses to the next level New York Post
- Latest Update Aims to Make Meta's Ray-Ban Display Smart Glasses More Useful PCMag
Fitbit 4.69 rolls out with redesign of focus stats and logging - 9to5Google
2026-05-15 14:00
- Fitbit 4.69 rolls out with redesign of focus stats and logging 9to5Google
- Introducing the all-new Fitbit Air blog.google
- Google Finally Made the Fitness Tracker Apple and Whoop Wouldn’t Gear Patrol
- Google Health Premium vs. Basic Features: Worth Paying For? Droid Life
- Google Fitbit Air: 6 unique features that could tempt us to switch Mashable
LG OLED G6 Series Review: Top-End TV Net Gain for Picture Quality - CNET
2026-05-14 12:12
- LG OLED G6 Series Review: Top-End TV Net Gain for Picture Quality CNET
- LG has asked us to re-test the four-star flagship G6 OLED TV – here's why What Hi-Fi?
- I tested LG's new big-screen C6H TV, and it's the brand's biggest OLED upgrade in years Business Insider
- LG C6 vs LG G5: I put LG’s OLED TVs next to each other to judge which is better value now that they’re similar prices — and it’s not the obvious answer that you might assume TechRadar
- LG C6 (2026) Review: A Refined Display For a Cinematic Viewing Exerience iPhone in Canada
Xbox is now XBOX - The Verge
2026-05-15 23:10
- Xbox is now XBOX The Verge
- Xbox CEO Wants To Know If You Spell It "Xbox" Or "XBOX" GameSpot
- Xbox or XBOX? CEO Asha Sharma polled nearly 20,000 fans, and their answer is surprising Windows Central
- Should Microsoft's console be spelled Xbox or XBOX? Gamereactor UK
- Xbox 25th Anniversary Sparks Branding Debate as 'XBOX vs Xbox' Poll Gains Attention player.one
NASA - Breaking News
NASA Science, Cargo Launch on 34th SpaceX Resupply Mission to Station
2026-05-15 22:52
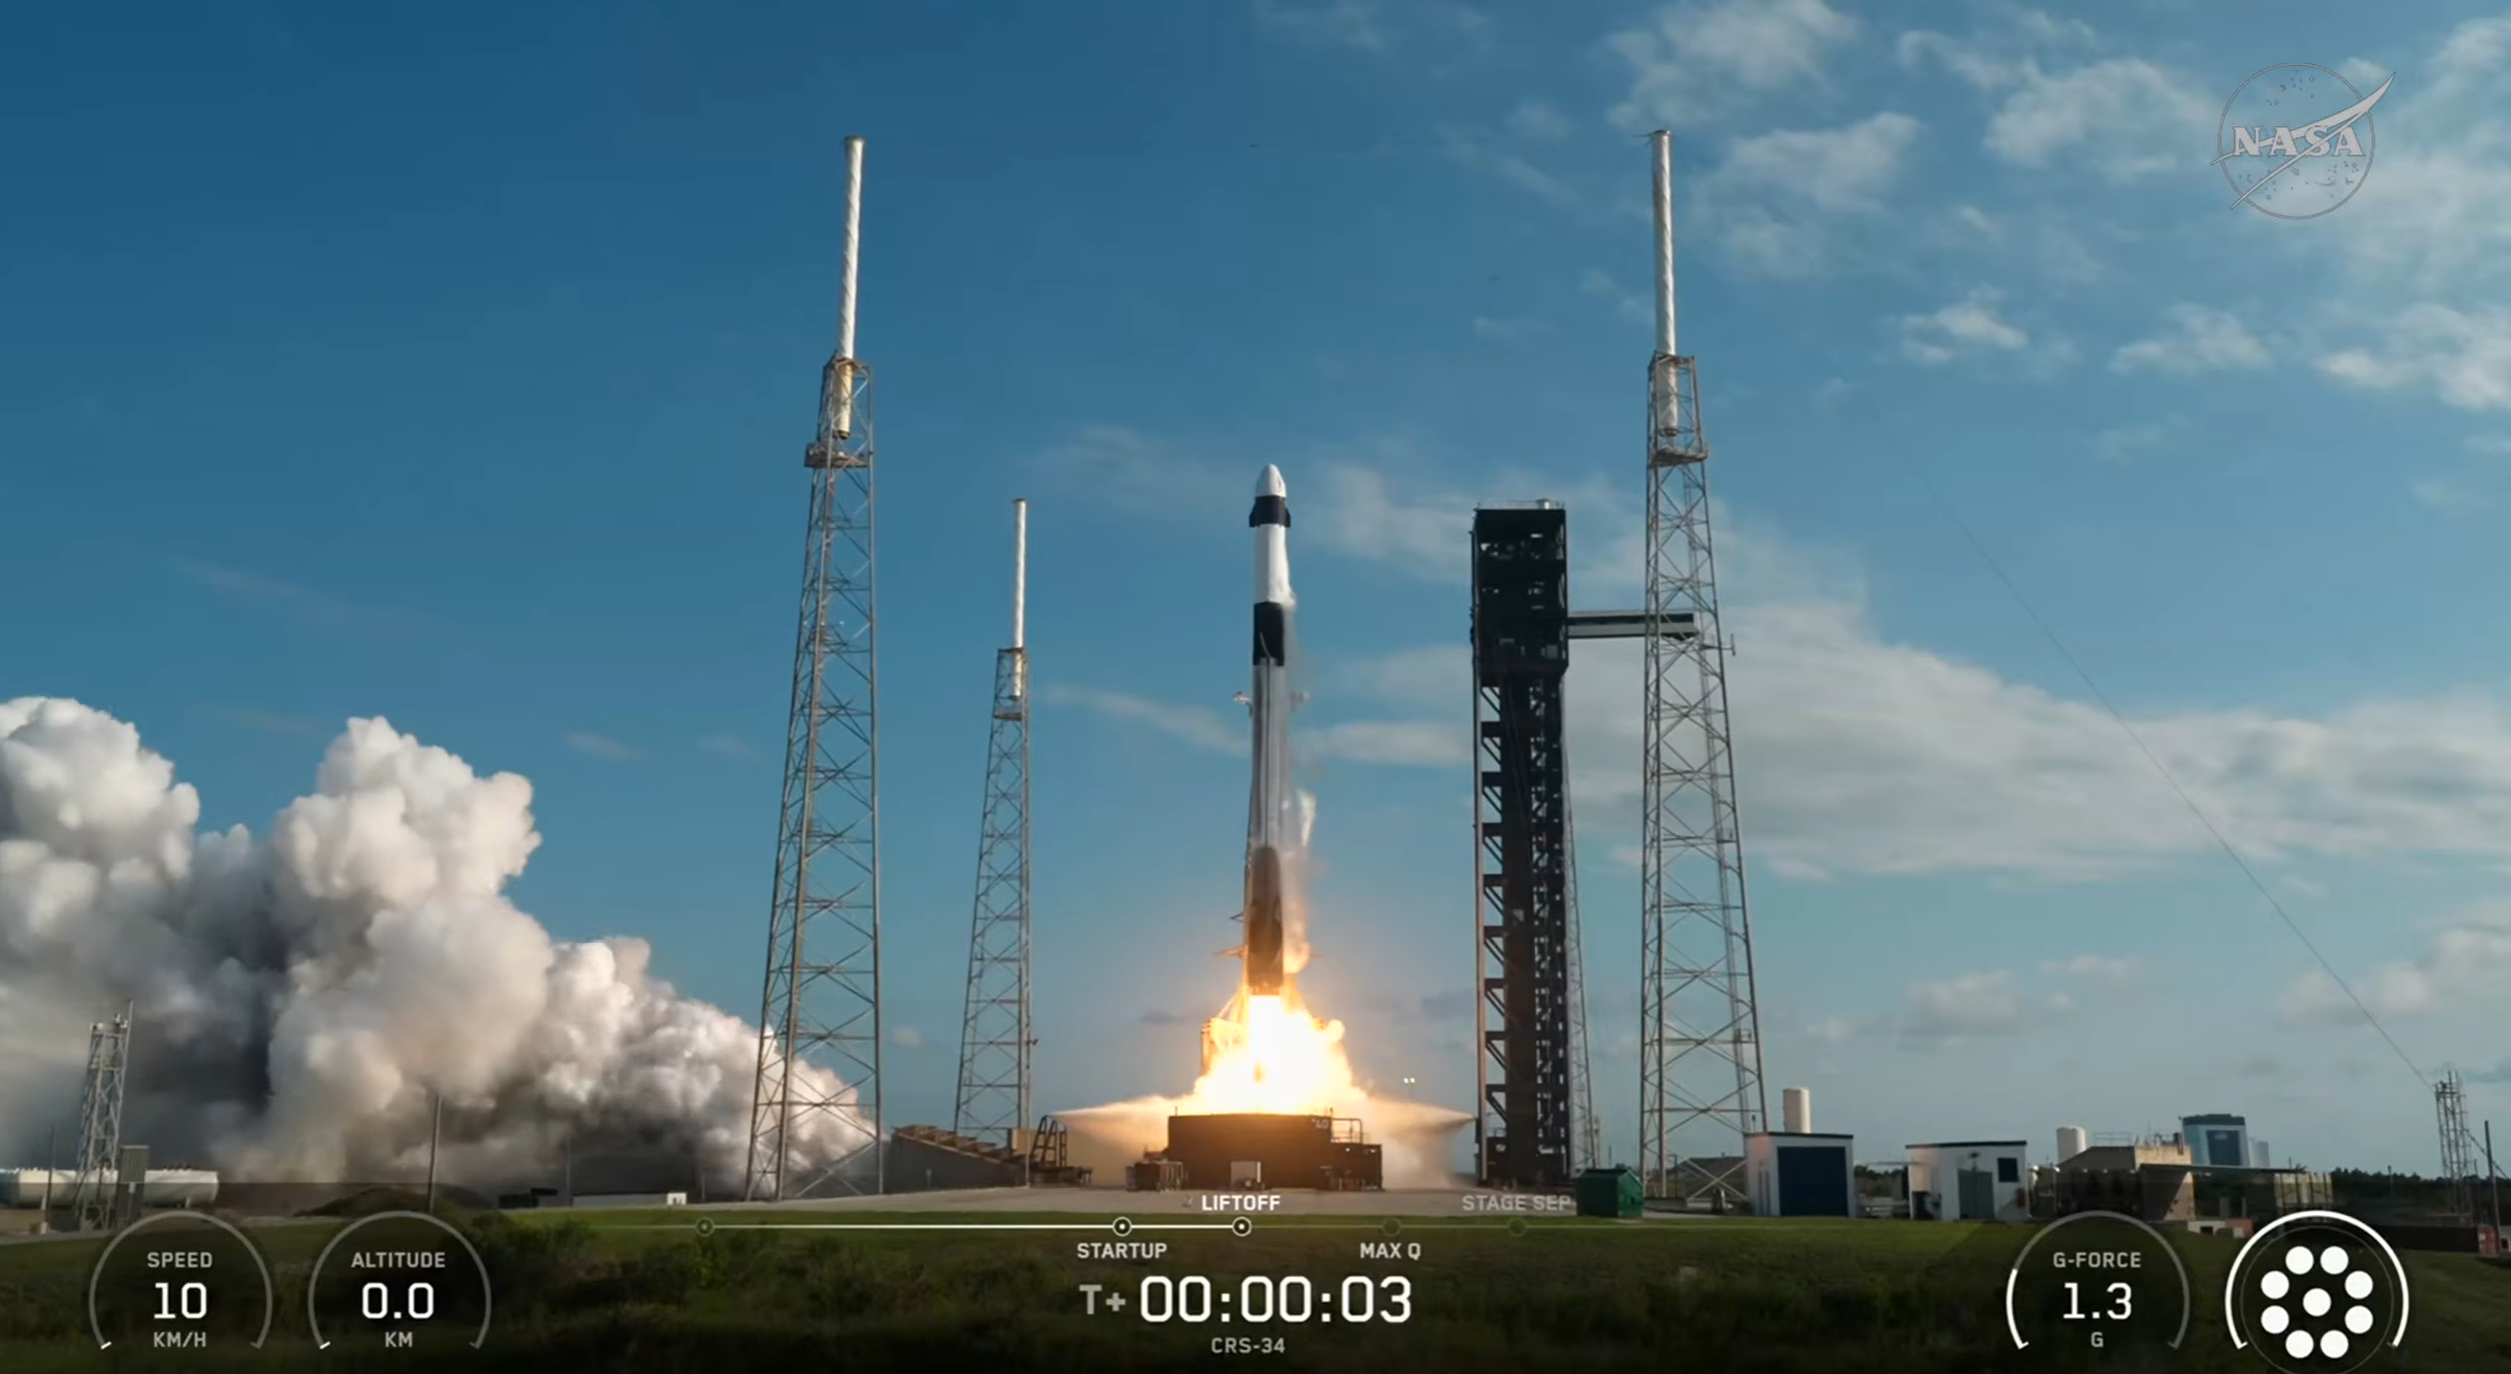
The 34th SpaceX commercial resupply mission under contract with NASA is headed to the International Space Station with new scientific experiments after lifting off at 6:05 p.m. EDT Friday on a Falcon 9 rocket from Space Launch Complex 40 at Cape Canaveral Space Force Station in Florida.
The SpaceX spacecraft, loaded with nearly 6,500 pounds of cargo for the space station’s Expedition 74 crew, is scheduled to autonomously dock at about 7 a.m. Sunday, May 17, to the forward port of the station’s Harmony module.
Watch NASA’s live rendezvous and docking coverage beginning at 5:30 a.m. on NASA+, Amazon Prime, and the agency’s YouTube channel. Learn how to watch NASA content through a variety of online platforms, including social media.
In addition to cargo for the crew aboard the space station, Dragon will deliver several new experiments, including a project to determine how well Earth-based simulators mimic microgravity conditions, a bone scaffold made from wood that could produce new treatments for fragile bone conditions like osteoporosis, and equipment to help researchers evaluate how red blood cells and the spleen change in space. The Dragon spacecraft also will carry a new instrument to study charged particles around Earth that can impact power grids and satellites, an investigation that could provide a fundamental understanding of how planets form, and an instrument designed to take highly accurate measurements of sunlight reflected by Earth and the Moon.
These experiments are just a sample of the hundreds of investigations conducted aboard the orbiting laboratory in the areas of biology and biotechnology, physical sciences, and Earth and space science. For more than 25 years, people have lived and worked continuously aboard the International Space Station, advancing scientific knowledge and making research breakthroughs that aren’t possible on Earth. The space station helps NASA understand and overcome the challenges of human spaceflight, expand commercial opportunities in low Earth orbit, and build on the foundation for long-duration missions to the Moon, as part of the Artemis program, and to Mars.
The Dragon spacecraft is scheduled to remain at the station until mid-June, when it will depart and return to Earth with time-sensitive research and cargo, ahead of splashing down off the coast of California.
Learn more about International Space Station research, operations, and its crews at:
-end-
Jimi Russell
Headquarters, Washington
202-358-1100
james.j.russell@nasa.gov
Danielle Sempsrott / Leejay Lockhart
Kennedy Space Center, Fla.
321-867-2468
danielle.c.sempsrott@nasa.gov / leejay.lockhart@nasa.gov
Sandra Jones / Joseph Zakrzewski
Johnson Space Center, Houston
281-483-5111
sandra.p.jones@nasa.gov / joseph.a.zakrzewski@nasa.gov
Curiosity Shakes Loose a Pesky Rock
2026-05-15 14:45
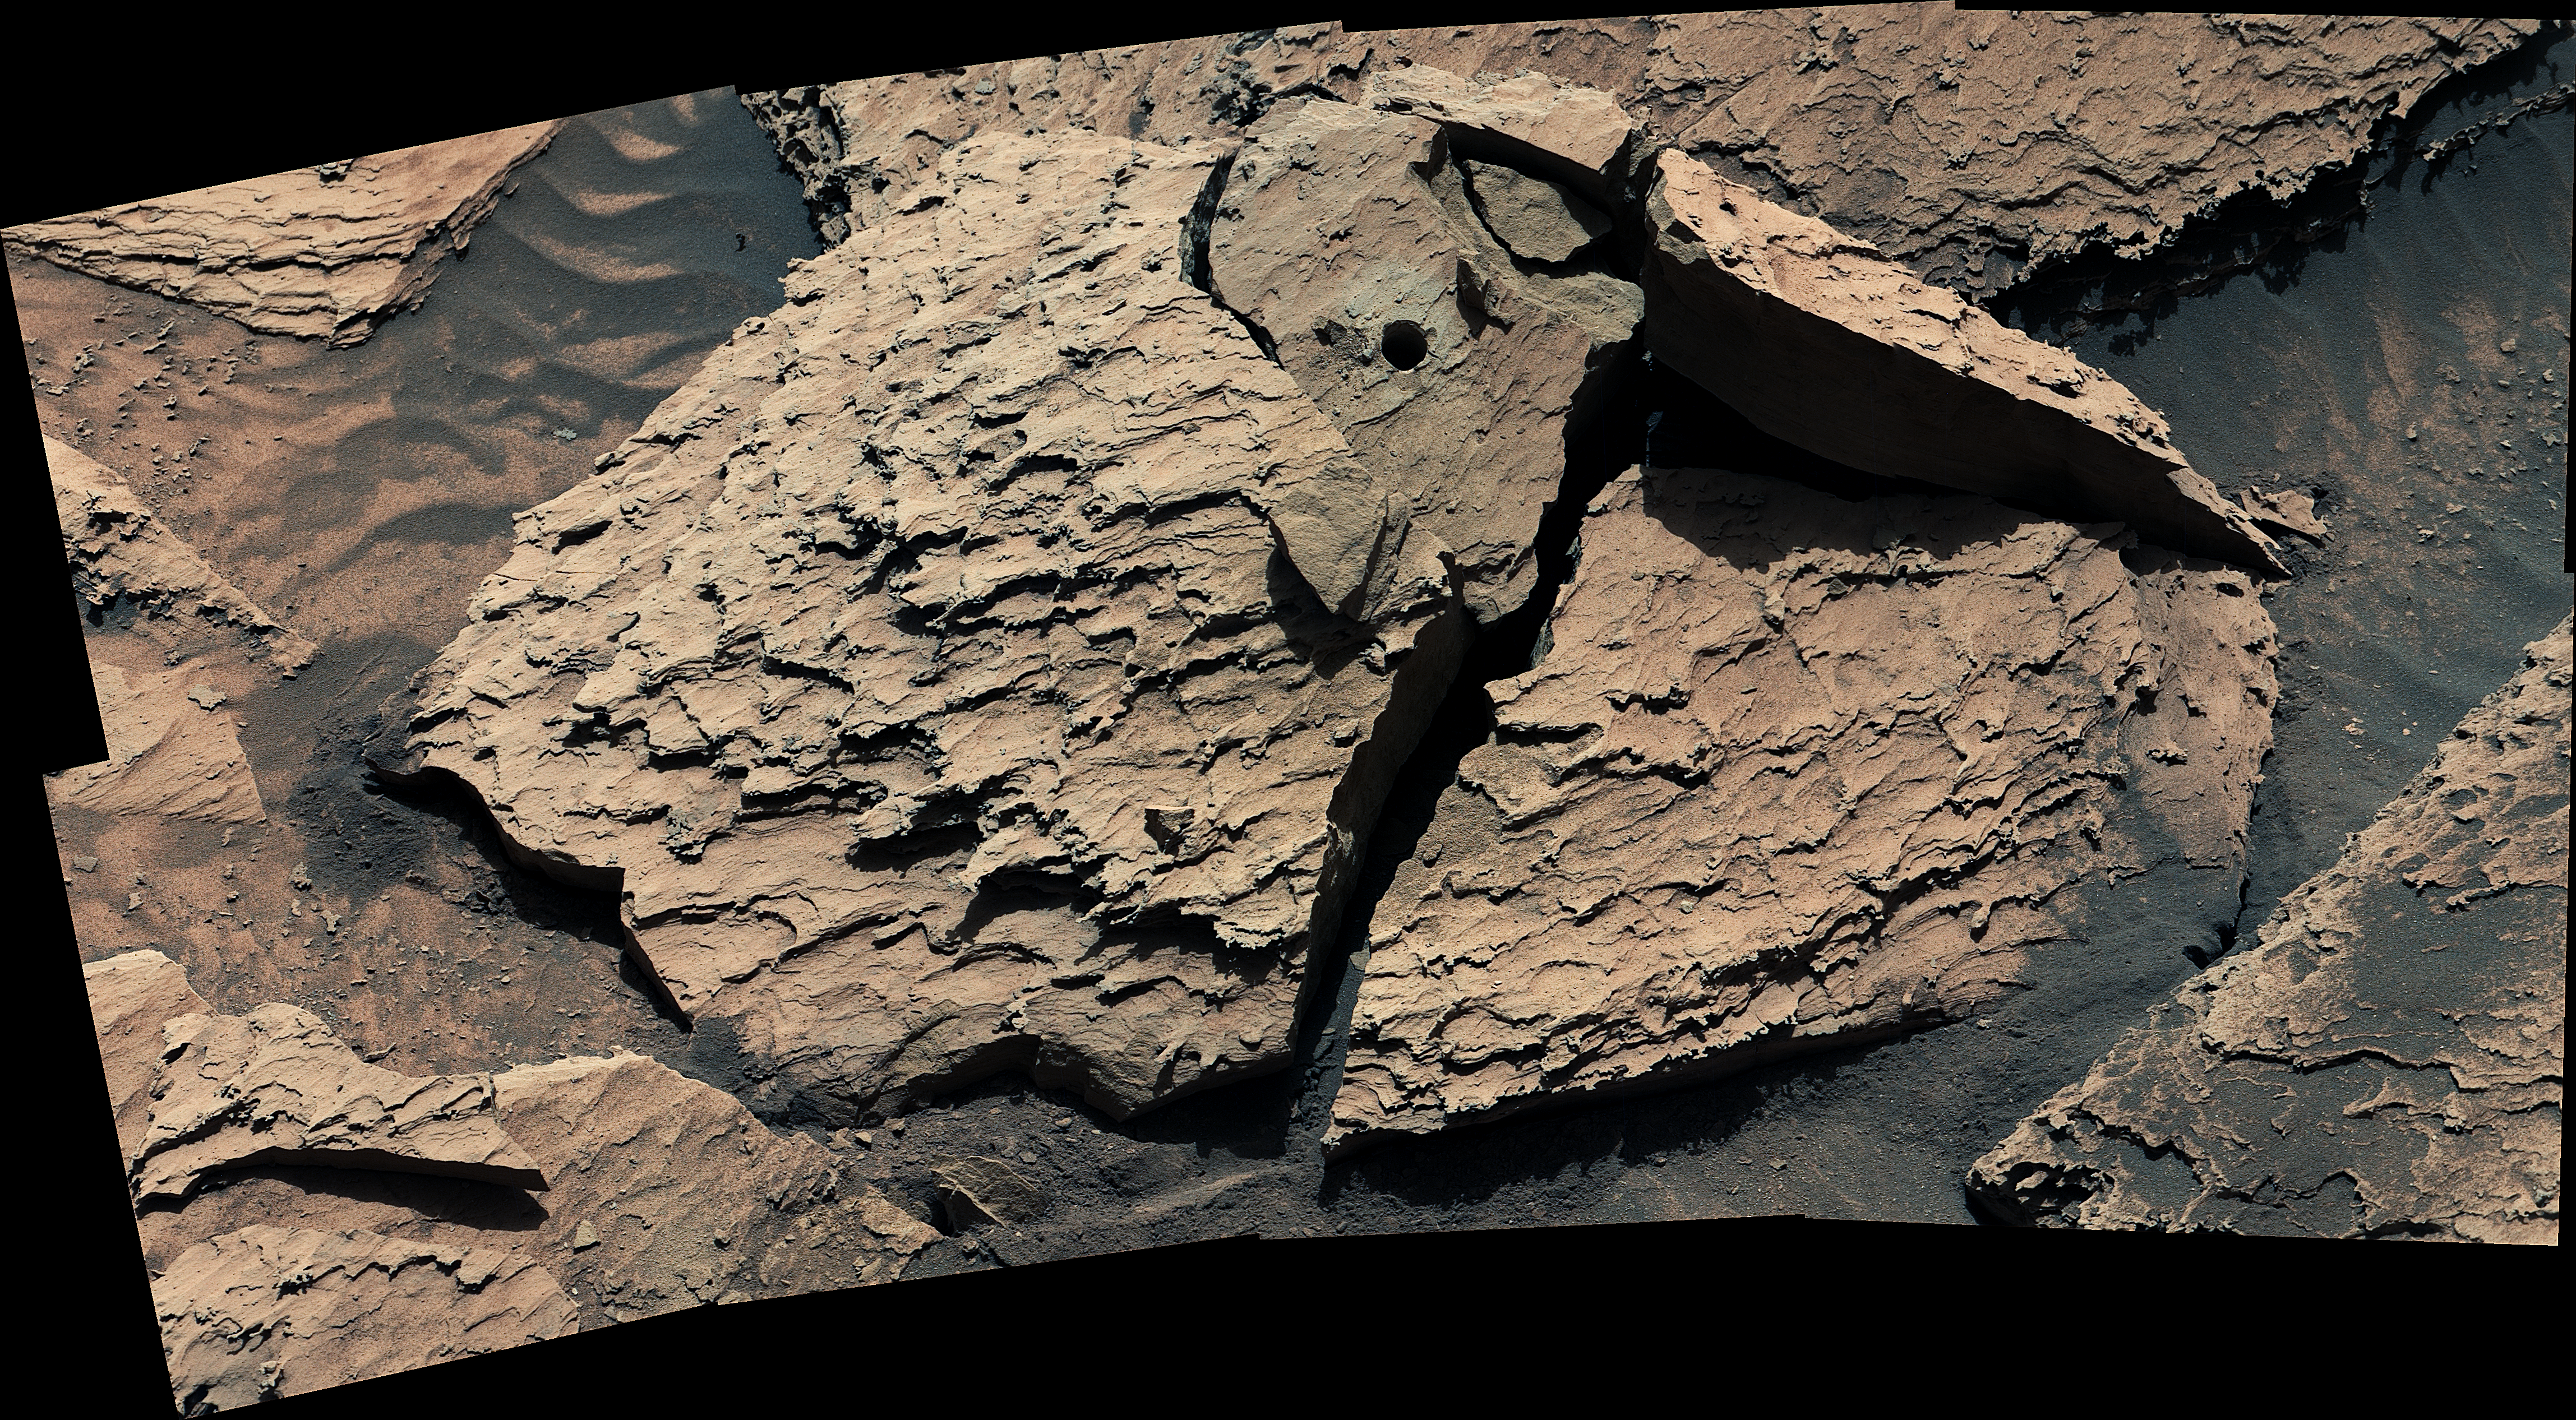
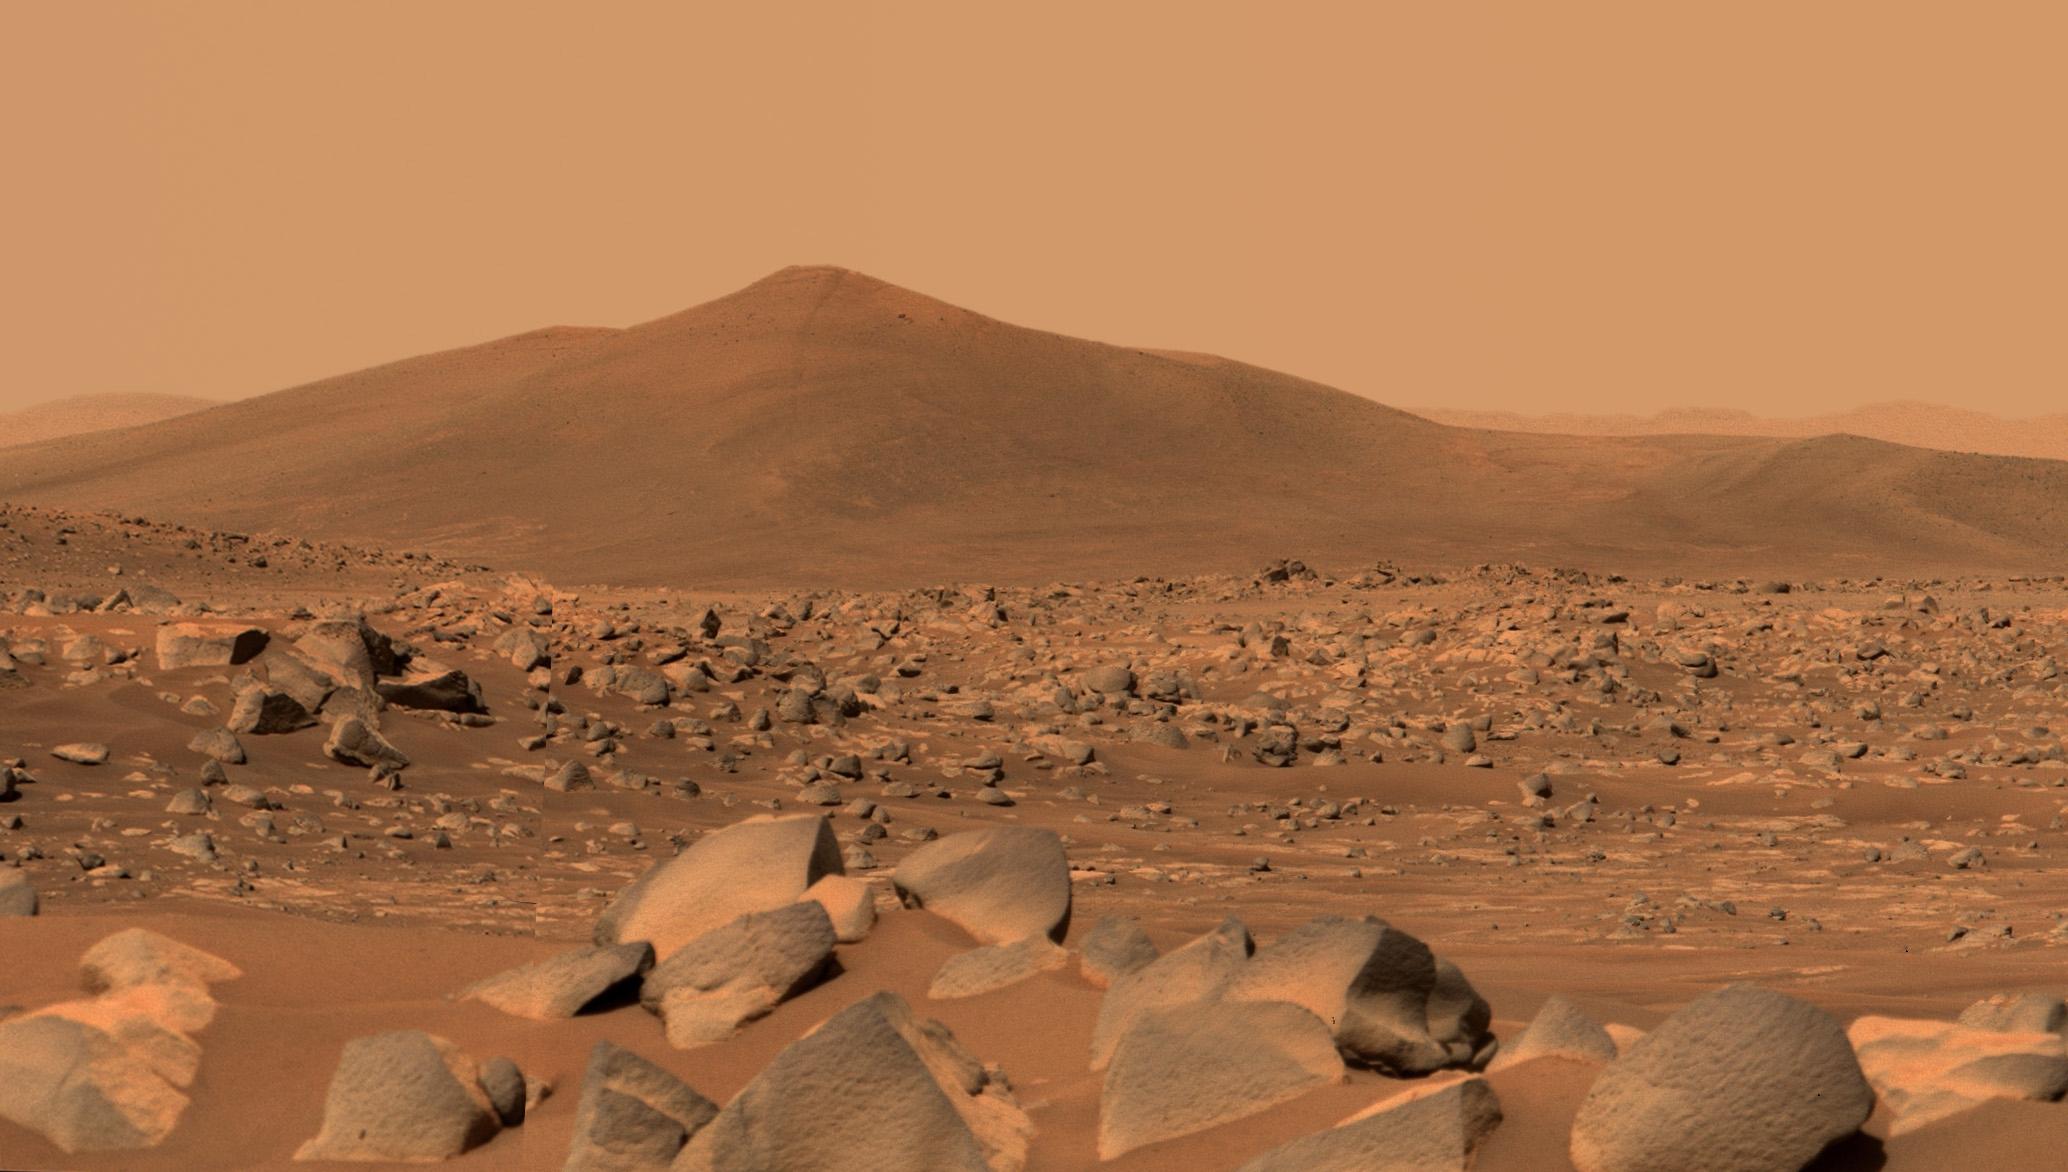
After NASA’s Curiosity Mars rover drilled a sample from this rock on April 25, 2026, it withdrew its robotic arm and pulled the entire rock off the surface with it. Engineers spent several days repositioning the arm and vibrating the drill to try and get the rock loose. When it finally detached on May 1, the rock broke into pieces.
This close-up image of the rock was produced by Curiosity’s Mast Camera, or Mastcam, on May 6. Nicknamed “Atacama,” the rock is estimated to be 1.5 feet in diameter at its base and 6 inches thick. It would weigh roughly 28.6 pounds on Earth (and about a third of that on Mars). The circular hole produced by Curiosity’s drill is visible in the rock.
See Atacama stuck on Curiosity’s drill.
Credit: NASA/JPL-Caltech/MSSS
Hubble Sights Galaxy in Transition
2026-05-15 12:01
3 min read
Hubble Sights Galaxy in Transition

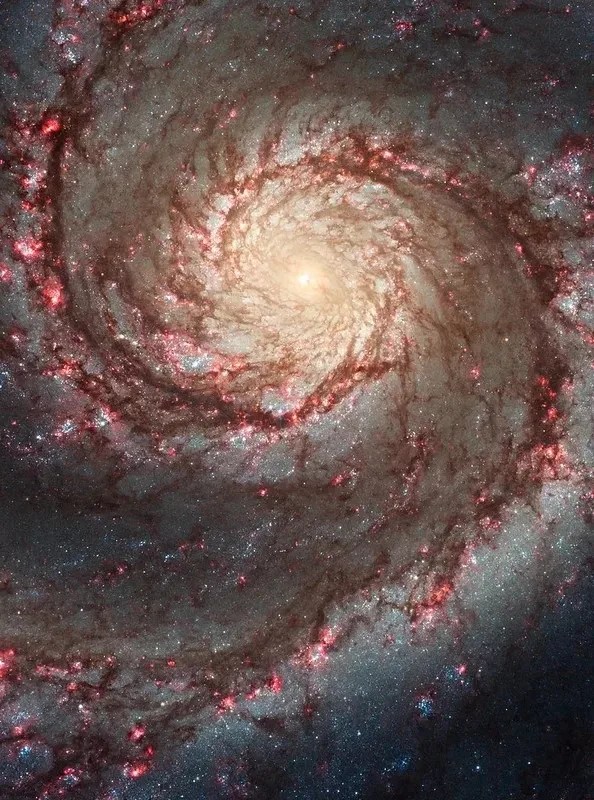
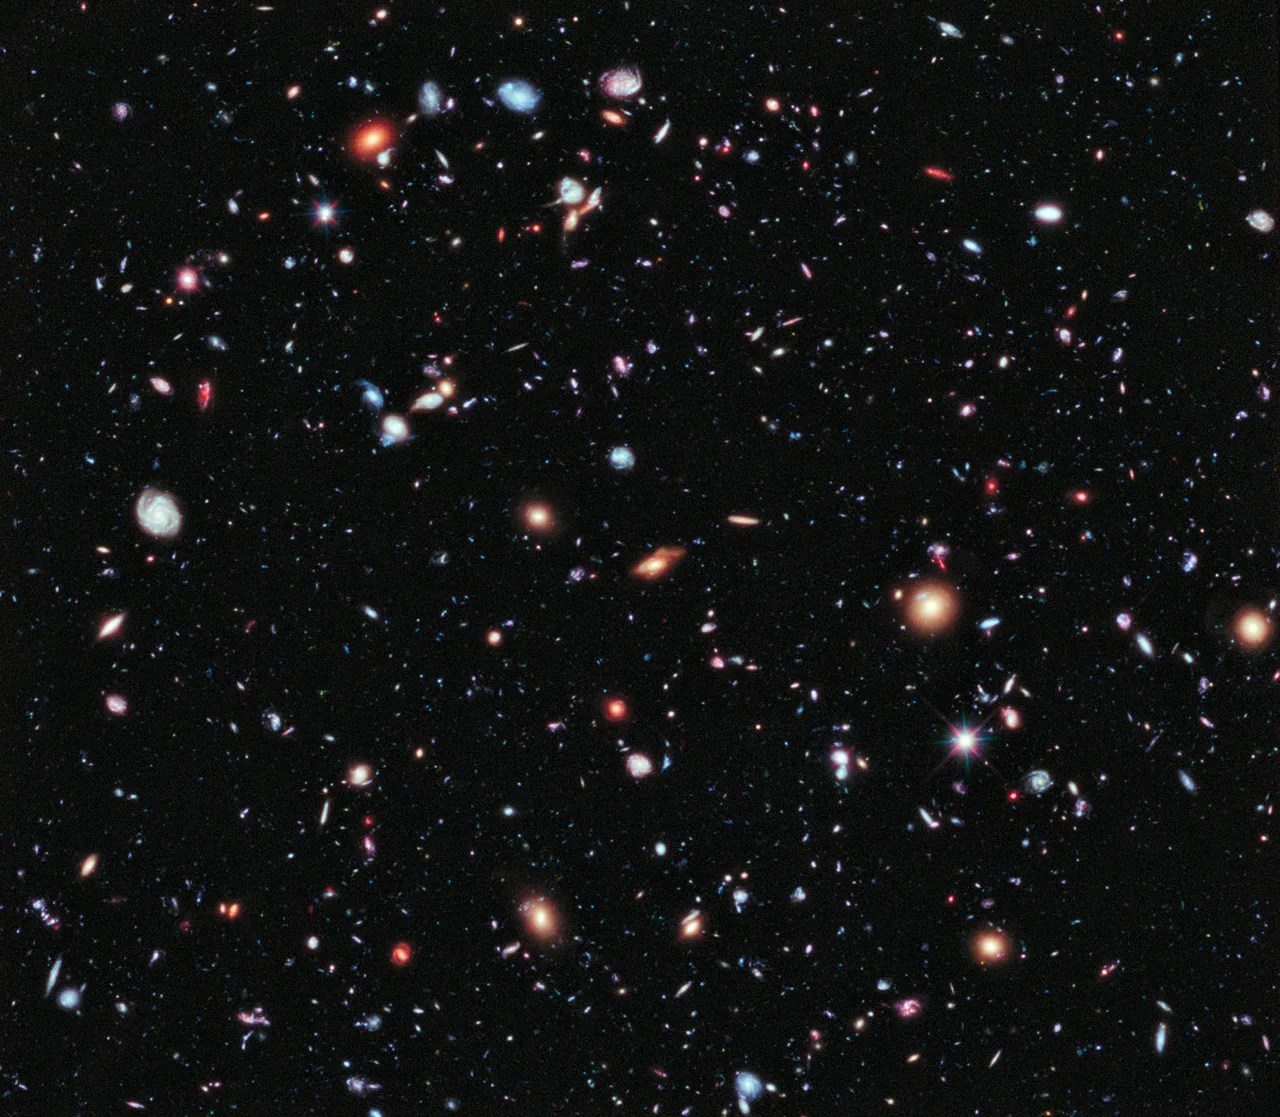
This NASA Hubble Space Telescope image reveals an enigmatic galaxy with a bright center and a face that hints at spiral structure, yet it holds no obvious spiral arms. Reddish-brown clumps and filaments of dust partially obscure the galaxy’s full face, while red, blue, and orange light from distant galaxies shines through its diffuse outer regions and dots the inky-black background.
NGC 1266 is a lenticular galaxy located some 100 million light-years away in the constellation Eridanus (the Celestial River). Astronomers classify lenticulars as transitional galaxies that represent an evolutionary bridge between spirals and ellipticals. Lenticulars are “lens-shaped” and have a bright central bulge and flattened disk like spirals, but they have no spiral arms and little to no star formation like ellipticals.
As interesting as this galaxy’s structure and lenticular classification are, those traits aren’t its most intriguing features. NGC 1266 is a rare post-starburst galaxy that is in transition between a galaxy that experienced a major burst of star formation and a quieter elliptical galaxy. Post-starburst galaxies have a young population of stars but few star-forming regions. Roughly one percent of the local galaxy population is a post-starburst galaxy.
Astronomers think that NGC 1266 had a minor merger with another galaxy some 500 million years ago. The merger spurred the formation of new stars and increased the mass of the galaxy’s central bulge while funneling gas into its supermassive black hole. The additional matter made the black hole much more active, creating an active galactic nucleus or AGN. The black hole’s increased activity would have generated powerful winds and jets of gas along its axis of rotation. Over time, the burst of new stars and the black hole’s powerful jets would deplete the galaxy’s reservoir of star-forming gas, while the turbulence generated in these processes suppressed new stars from forming in the gas that remained.
Observations by Hubble and other observatories reveal a strong outflow of gas from the galaxy and that the space between its stars is shocked or highly disturbed. Researchers found that any remaining stellar nurseries are in the core of the galaxy, and that very little to no star formation happens beyond that core. These observations suggest the supermassive black hole in the galaxy’s heart may be suppressing star birth by stripping or ejecting star-forming gas from the galaxy. The shockwaves from this process would create turbulence that disturbs the gas and dust between stars enough to stop any remaining matter from gravitationally condensing into infant stars.
Post-starburst galaxies like NGC 1266 are ideal subjects for astronomers to study the complex physical processes that suppress star formation. They help us better understand the evolution of galaxies and how supermassive black holes interact with their hosts.
Media Contact:
Claire Andreoli
NASA’s Goddard Space Flight Center, Greenbelt, MD
claire.andreoli@nasa.gov

Picturing Earth in a New Light
2026-05-15 04:00

Maps can show more than just where things are—they can also show how things change. New maps of artificial light reveal a planet that has been reshaping its nights through patterns of brightening and dimming.
The maps are based on a recent analysis of NASA’s Black Marble data, which found that instead of a gradual increase in artificial light at night over the course of nearly a decade, the patterns are much more nuanced. The analysis portrays a world flickering with industrial booms and busts, construction, and blackouts, as well as more gradual shifts, such as policy-driven retrofits.
NASA’s Black Marble product uses observations from the VIIRS (Visible Infrared Imaging Radiometer Suite) sensors on the Suomi-NPP, NOAA-20, and NOAA-21 satellites to produce records of nighttime lights at daily, monthly, and yearly time scales. The VIIRS day-night band detects nighttime light in a range of wavelengths from green to near-infrared and uses filtering techniques to observe signals such as city lights, reflected moonlight, and auroras.
The map above shows changes in brightness across most of the inhabited world (between 60 degrees south and 70 degrees north). Yellow and gold areas are where there has been more brightening during the study period, from 2014 to 2022, and purple areas are where there has been more dimming.
The visualization below shows the same data for the Eastern Hemisphere. Note that this version includes some artistic touches, such as simulated sunlight and shadows, while the nighttime lights data overlaid on the globe remain grounded in the scientific analysis. The image was featured on the cover of Nature, where the study was published in April 2026.

Overall, the researchers found that global radiance increased by 34 percent during the study period, but that surge masks large areas of dimming. Such “bidirectional changes” often happen side by side. In the U.S., for example, West Coast cities grew brighter as their populations increased, while much of the East Coast showed dimming, which the team attributed to the increased use of energy-efficient LEDs and broader economic restructuring.
The authors concluded that internationally, nighttime light surged in China and northern India along with urban development, while LEDs and energy conservation measures coincided with reduced light pollution in Paris and throughout France (a 33 percent dimming), the UK (22 percent dimming), and the Netherlands (21 percent dimming). European nights dimmed sharply in 2022 during a regional energy crisis that followed the outbreak of the Russia-Ukraine conflict.
Large versions of the maps on this page can be downloaded below. Animations showing annual changes in nighttime lights throughout the study period are available from NASA’s Scientific Visualization Studio.
NASA Earth Observatory images by Michala Garrison, using data from Li, T., et al. (2026). Story by Sally Younger adapted for Earth Observatory by Kathryn Hansen.


References & Resources
- Li, T., et al. (2026) Satellite imagery reveals increasing volatility in human night-time activity. Nature, 652, 379–386.
- NASA (2026, April 13) NASA Night-light Imagery Tracks US Energy Transition, Global Volatility. Accessed May 14, 2026.
- NASA’s Scientific Visualization Studio (2026, April 8) Global Nighttime Lights Change (2014–2022). Accessed May 14, 2026.
You may also be interested in:
Stay up-to-date with the latest content from NASA as we explore the universe and discover more about our home planet.

The expansion of greenhouses in southern Ontario is changing the appearance of the land surface—and the night sky.

A vivid display of the aurora lit up skies over the Denmark Strait and eastern Canada during a minor geomagnetic…

A series of nighttime satellite images revealed how moonlight reaching Earth varied throughout a total lunar eclipse.


NASA Draws on Industry for Mars Telecommunications Network
2026-05-14 20:53
On Thursday, NASA issued a Request for Proposal (RFP), seeking industry collaboration for the Mars Telecommunications Network.
Reliable, high bandwidth communications is necessary to relay science data, high-definition imagery, and critical information during Mars missions. The network will use high-performance Mars telecommunications orbiters at the Red Planet to support future surface, orbital, and human exploration.
This RFP builds on a draft released April 2, as well as insights gathered during the accompanying industry day at NASA’s Goddard Space Flight Center in Greenbelt, Maryland, where commercial partners provided feedback on agency objectives for the Mars Telecommunications Network.
The request seeks responses that address both current and future operational missions. It also seeks a science payload accommodation that will be selected by NASA’s Science Mission Directorate. Industry is asked to respond within 30 calendar days of the posting, and the network should be ready to operate at Mars no later than 2030.
The Mars Telecommunications Network is part of NASA’s evolving space architecture, extending continuous network services beyond Earth to the Moon and Mars. The Mars Telecommunications Network is part of NASA’s SCaN (Space Communications and Navigation) Program’s Moon to Mars strategy, and is enabled by the direction and funding provided by Congress in the Working Families Tax Cut Act.
To learn more about NASA’s deep space exploration, visit:
TechCrunch - Latest
RJ Scaringe has raised more than $12B across three startups and investors still want more
2026-05-15 20:30
General Catalyst posted VC rage bait and it worked, especially on a16z
2026-05-15 20:25
A hotel check-in system left a million passports and driver’s licenses open for anyone to see
2026-05-15 18:51
Silicon Valley’s vacationland needs a new energy provider just as AI is driving prices up
2026-05-15 18:14
Tesla reveals two Robotaxi crashes involving teleoperators
2026-05-15 17:13