📰 Trending Topics
Google News - Trending
Google News - Technology
Apple may take "several months" to catch up to Mac mini and Studio demand - Ars Technica
2026-05-01 14:10
- Apple may take "several months" to catch up to Mac mini and Studio demand Ars Technica
- Good Luck Getting a Mac Mini for the Next ‘Several Months’ WIRED
- Apple Stops Offering Mac Mini With 256GB of Storage, Starting Price Rises to $799 MacRumors
- Apple is facing Mac mini supply constraints as AI and OpenClaw developers buy up tiny desktops Yahoo Finance
- Mac lineup is doing so well that Apple can't keep up with demand AppleInsider
Gemini’s clean chat interface may not stay ad-free for long - Android Authority
2026-04-30 13:55
- Gemini’s clean chat interface may not stay ad-free for long Android Authority
- Google just gave its biggest hint that ads could come to Gemini Business Insider
- Google’s Gemini AI App Could Soon Start Showing Ads, Company Executive Reportedly Hints During Earnings... Gadgets 360
- Google is now open to exploring inclusion of ads in Gemini app: Report Business Standard
- Gemini May Not Stay Ad-Free for Long SammyGuru
The Commodore 64 and ZX Spectrum have been turned into retrofuturistic handhelds - The Verge
2026-04-30 13:45
- The Commodore 64 and ZX Spectrum have been turned into retrofuturistic handhelds The Verge
- The 1980s Speccy vs Commodore feud is back with these retro handhelds Creative Bloq
- Commodore 64 and ZX Spectrum receive clamshell makeover — iconic 8-bit legends join the handheld gaming wars Tom's Hardware
- Commodore 64 Handheld and ZX Spectrum Handheld: Blaze and Retro Games Ltd. Make It Happen Gearnews.com
- Spectrum and C64 being turned into handhelds by the makers of Evercade Eurogamer
ChatGPT Images 2.0 is a hit in India, but not a big winner elsewhere, yet - TechCrunch
2026-05-01 02:00
- ChatGPT Images 2.0 is a hit in India, but not a big winner elsewhere, yet TechCrunch
- I asked ChatGPT Images 2.0 to redesign my app UIs - and wow ZDNET
- I just tested ChatGPT Images 2.0 vs. Nano Banana with 7 prompts — here's the winner Tom's Guide
- OpenAI’s New Image Generator Is Trying to Take Your 6-Year-Old’s Job Gizmodo
- Shark Tank judge Anupam Mittal praises ChatGPT Images 2.0, says can fix this LinkedIn problem in seconds The Times of India
NASA - Breaking News
NASA Kennedy Center Director Announces Plans to Retire
2026-05-01 17:01
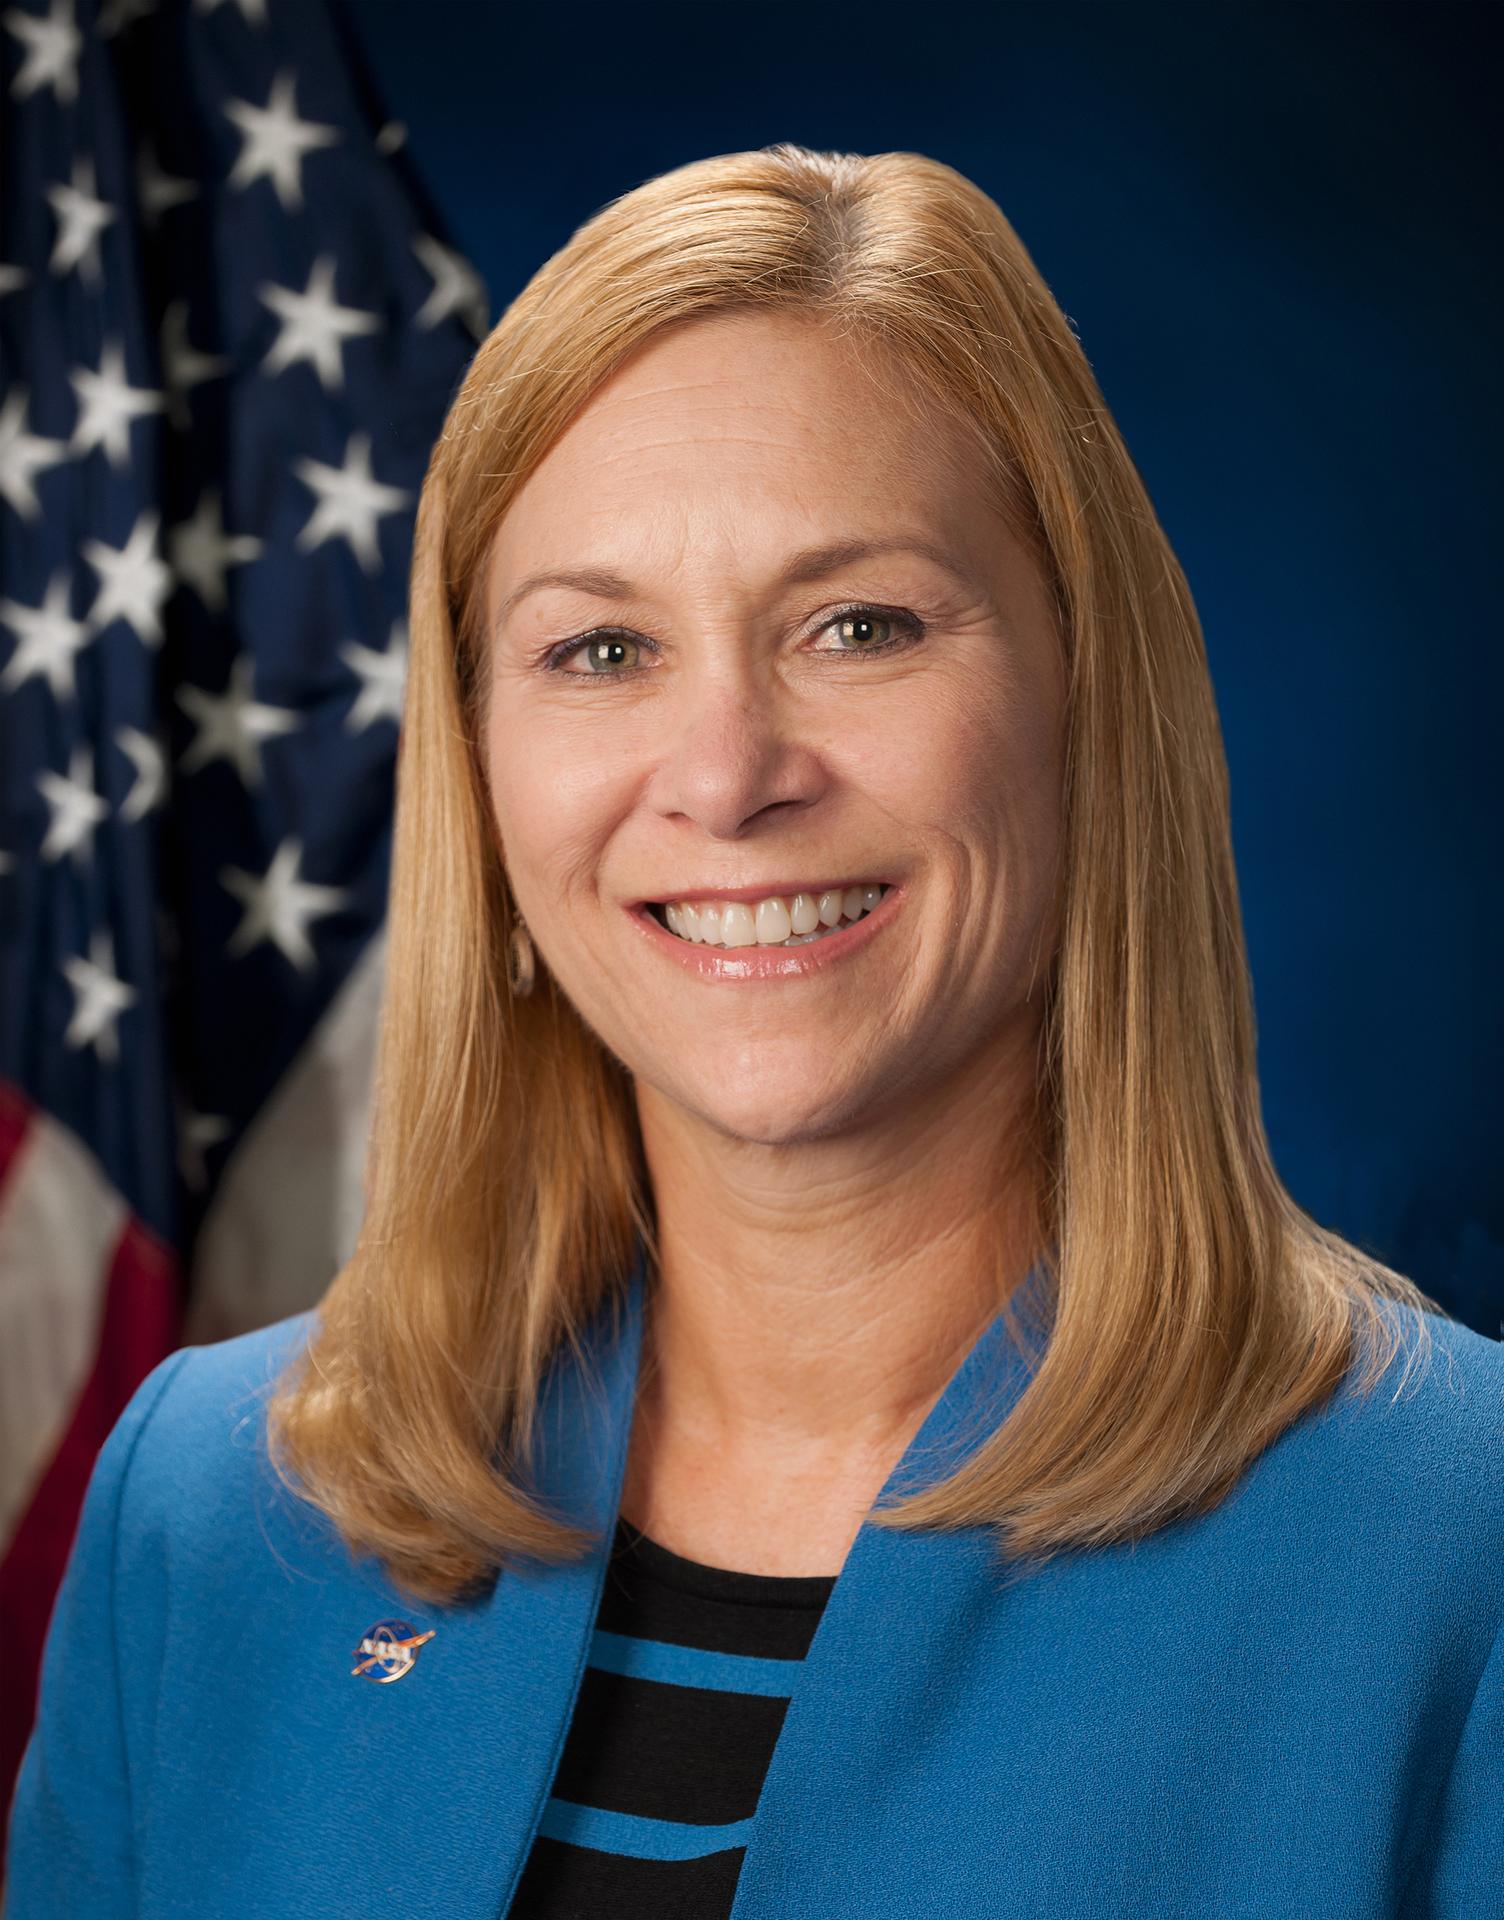
NASA announced Friday Janet Petro, center director for the agency’s Kennedy Space Center in Florida, is retiring.
Prior to joining NASA, Petro worked in a variety of military and industry positions, ultimately beginning her career at the agency in 2007 and working her way up to center director, as well as serving as acting administrator from January to July 2025.
“From the outset of her distinguished tenure at NASA, Janet has served as a profoundly influential leader, guiding both the agency and our Kennedy Space Center through some of the most significant transitions in our shared history, including playing a central role in reshaping NASA Kennedy into the nation’s premier multiuser spaceport,” said NASA Administrator Jared Isaacman. “As NASA has been charged, once again, with accomplishing the near impossible, I’m grateful for Janet for always embracing the challenge of discovering what could be and for pushing the boundaries to deliver the missions that enable NASA to lead the way into a new era of space.”
As NASA Kennedy’s 11th director, Petro manages a team of civil service and contractor employees, determining and implementing center policy and managing and executing the spaceport’s missions and agency program responsibilities. Previously, Petro served as acting director and NASA Kennedy’s deputy director. During her time as deputy director, she helped the center transition into a multi-user spaceport, leading cross-agency initiatives with the FAA (Federal Aviation Administration) and U.S. Air Force to streamline government processes and support commercial space operations to increase government efficiency and limit redundancy.
Petro also has served numerous roles at Kennedy and NASA Headquarters in Washington, including as the program executive on an agencywide initiative to restructure mission support functions, helping NASA become more efficient and effective in its work.
Outside of the agency, Petro has served in various management positions for Science Applications International Corporation, or SAIC, and McDonnell Douglas Aerospace Corporation, interfacing with NASA, U.S. military, and commercial entities on numerous aerospace and military programs.
Petro began her professional career as a commissioned officer in the U.S. Army after graduating in 1981 from the U.S. Military Academy at West Point, New York, with a bachelor of science degree in engineering. She was in the second class of West Point graduates to include women. Petro also holds a master of science degree in business administration from Boston University’s Metropolitan College.
Petro is the recipient of numerous service and performance awards, including a President’s Distinguished executive award, and has received the astronaut-selected Silver Snoopy award for outstanding performance, contributing to flight safety and mission success. In 2018, Petro was selected by Florida Governor Rick Scott for induction in the Florida Women’s Hall of Fame, and she helped lead the senior management team awarded the 2019 Samuel J. Heyman Service to America Sammies Management Excellence Medal. She received the 2022 Dr. Kurt H. Debus Award by the National Space Club Florida Committee for her contributions to America’s aerospace efforts within the state of Florida.
Effective Friday, Kelvin Manning now is stepping into the role of acting center director, bringing more than 32 years of leadership and technical expertise. He has previously served as deputy center director.
For more about NASA’s missions, visit:
-end-
Bethany Stevens / Cheryl Warner
Headquarters, Washington
202-358-1600
bethany.c.stevens@nasa.gov / cheryl.m.warner@nasa.gov
Amanda Griffin
Kennedy Space Center, Fla.
321-593-6244
amanda.griffin@nasa.gov
NASA Artemis II Crew Rings Nasdaq Closing Bell
2026-05-01 16:08
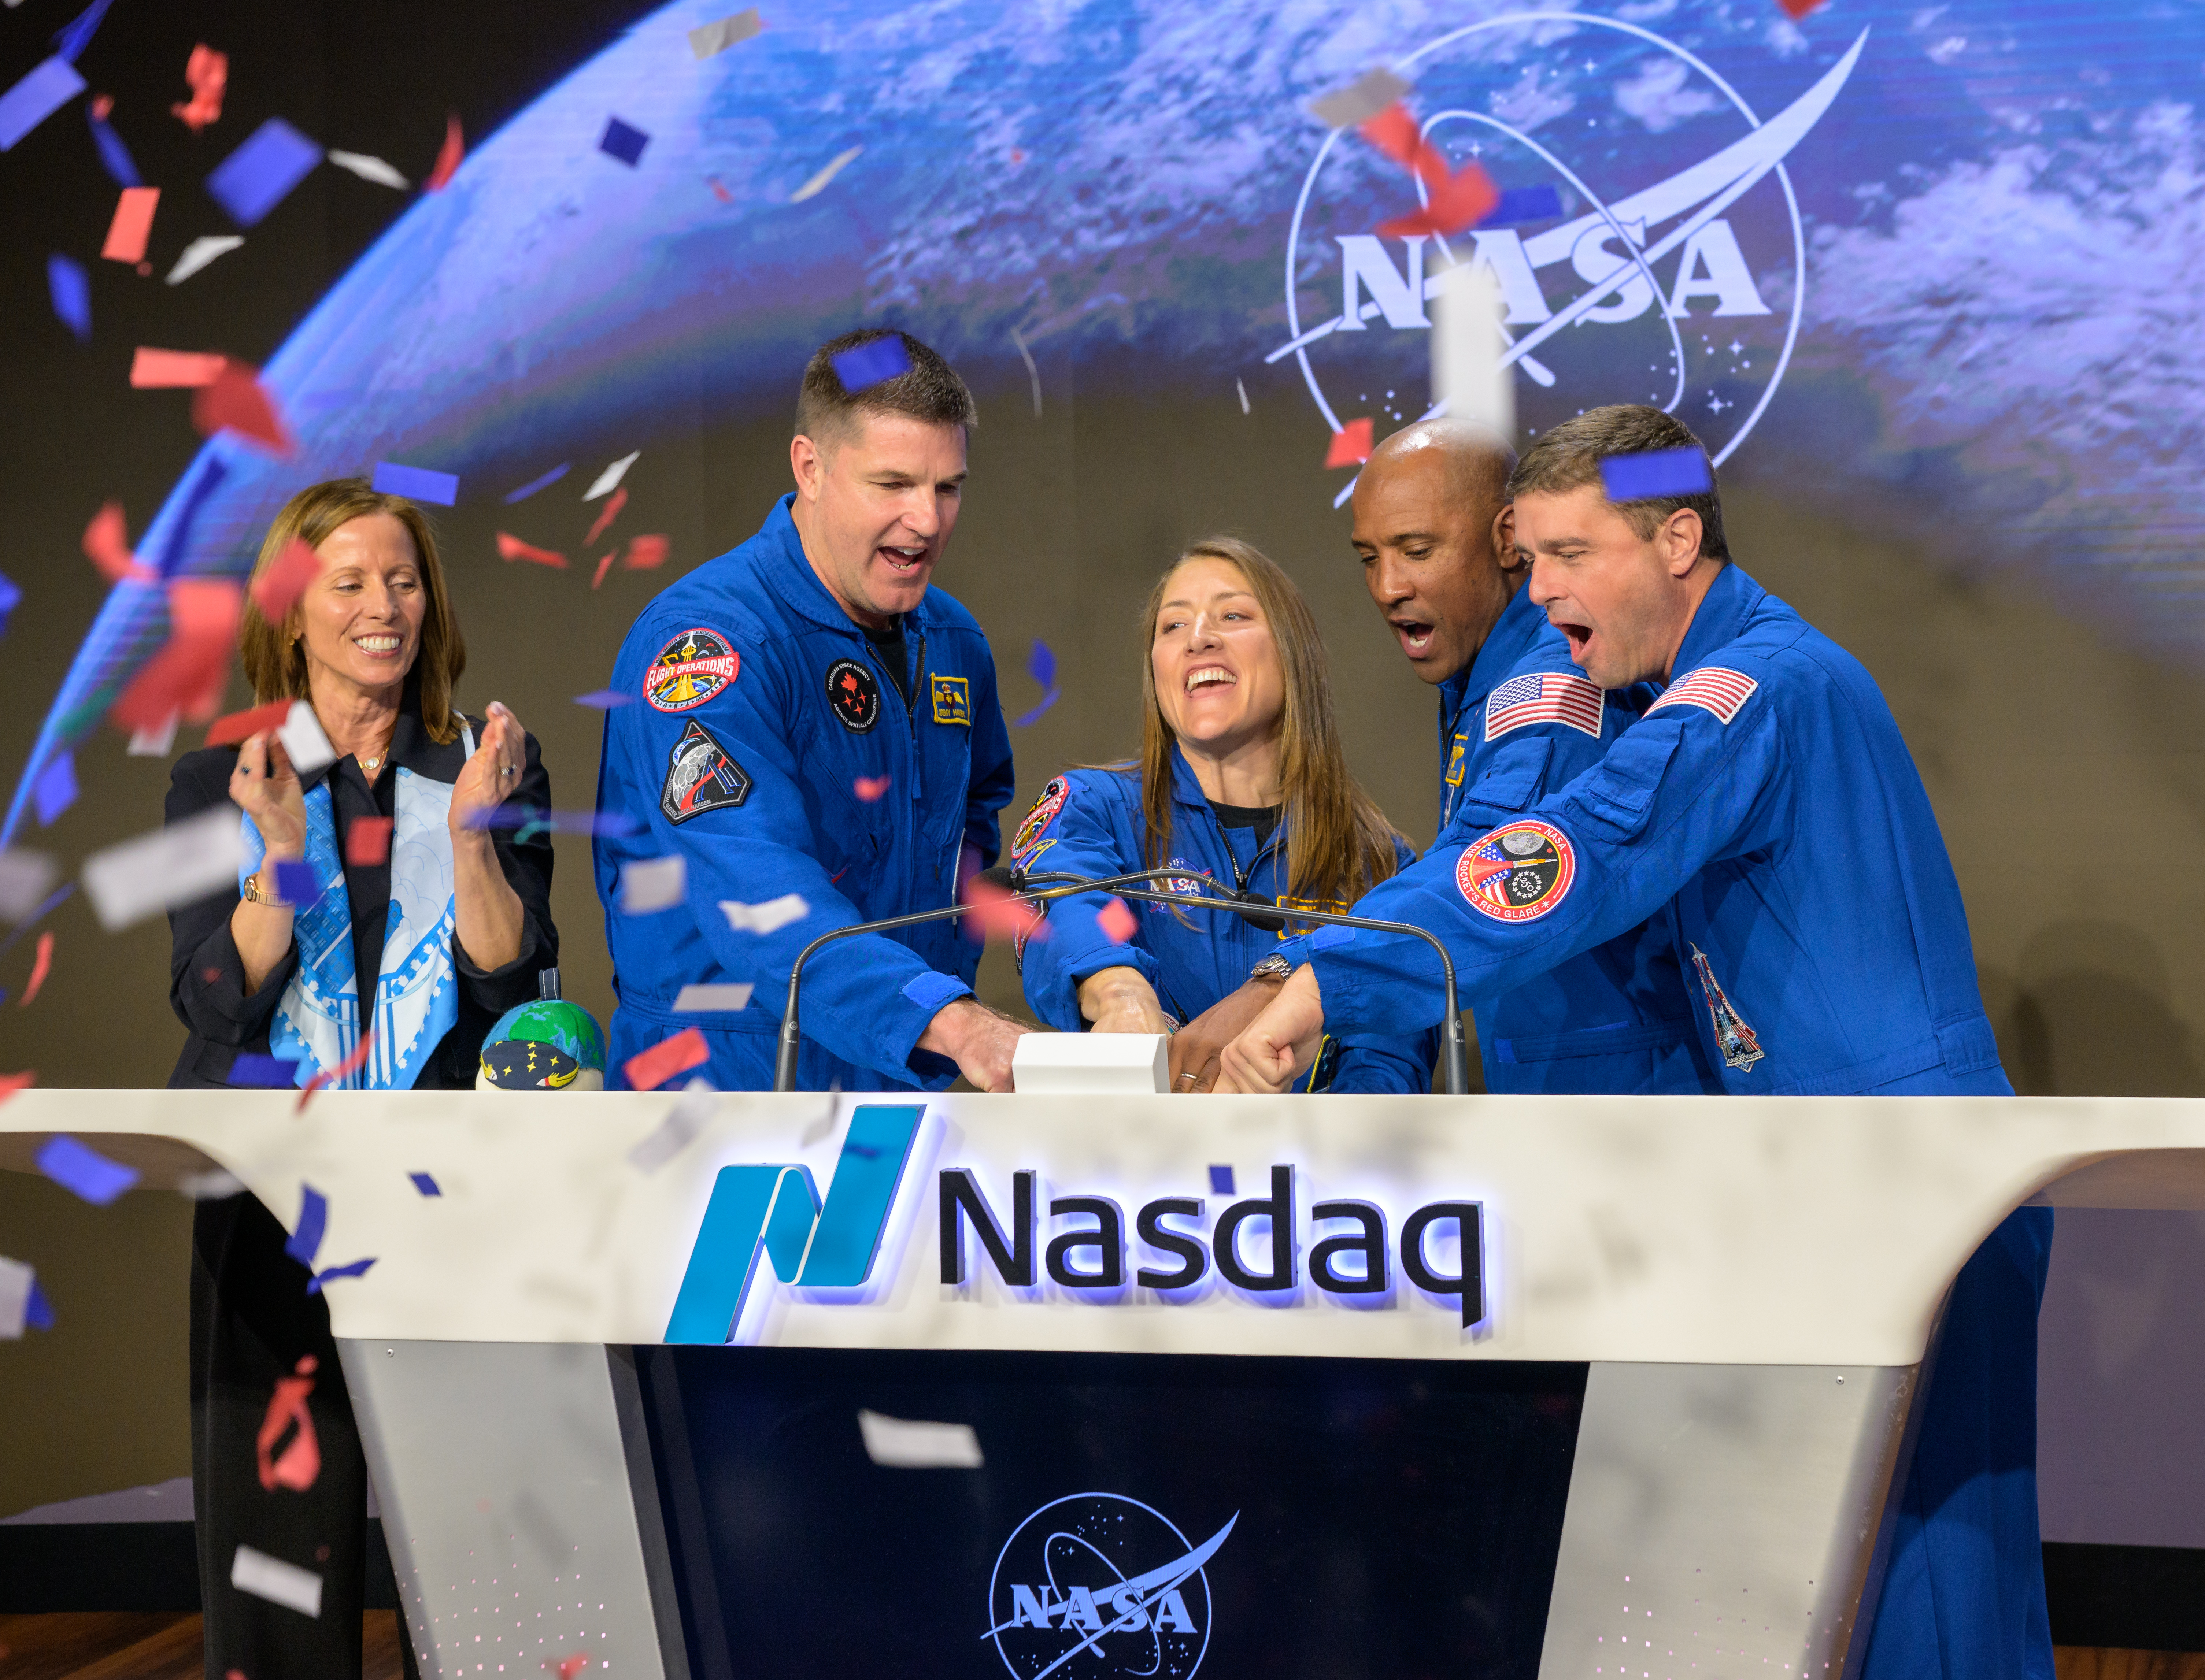
Nasdaq Chair and Chief Executive Officer Adena T. Friedman, left, and NASA’s Artemis II crewmembers CSA (Canadian Space Agency) astronaut Jeremy Hansen, and NASA astronauts Christina Koch, Victor Glover, and Reid Wiseman, right, ring the closing bell of the Nasdaq market session, Thursday, April 30, 2026.
NASA’s Artemis II mission took Wiseman, Glover, Koch, and Hansen on a nearly 10-day journey around the Moon and back to Earth earlier in April 2026.
Image credit: NASA/Bill Ingalls
Key Support Equipment Arrives at Kennedy for Roman Space Telescope
2026-05-01 15:44
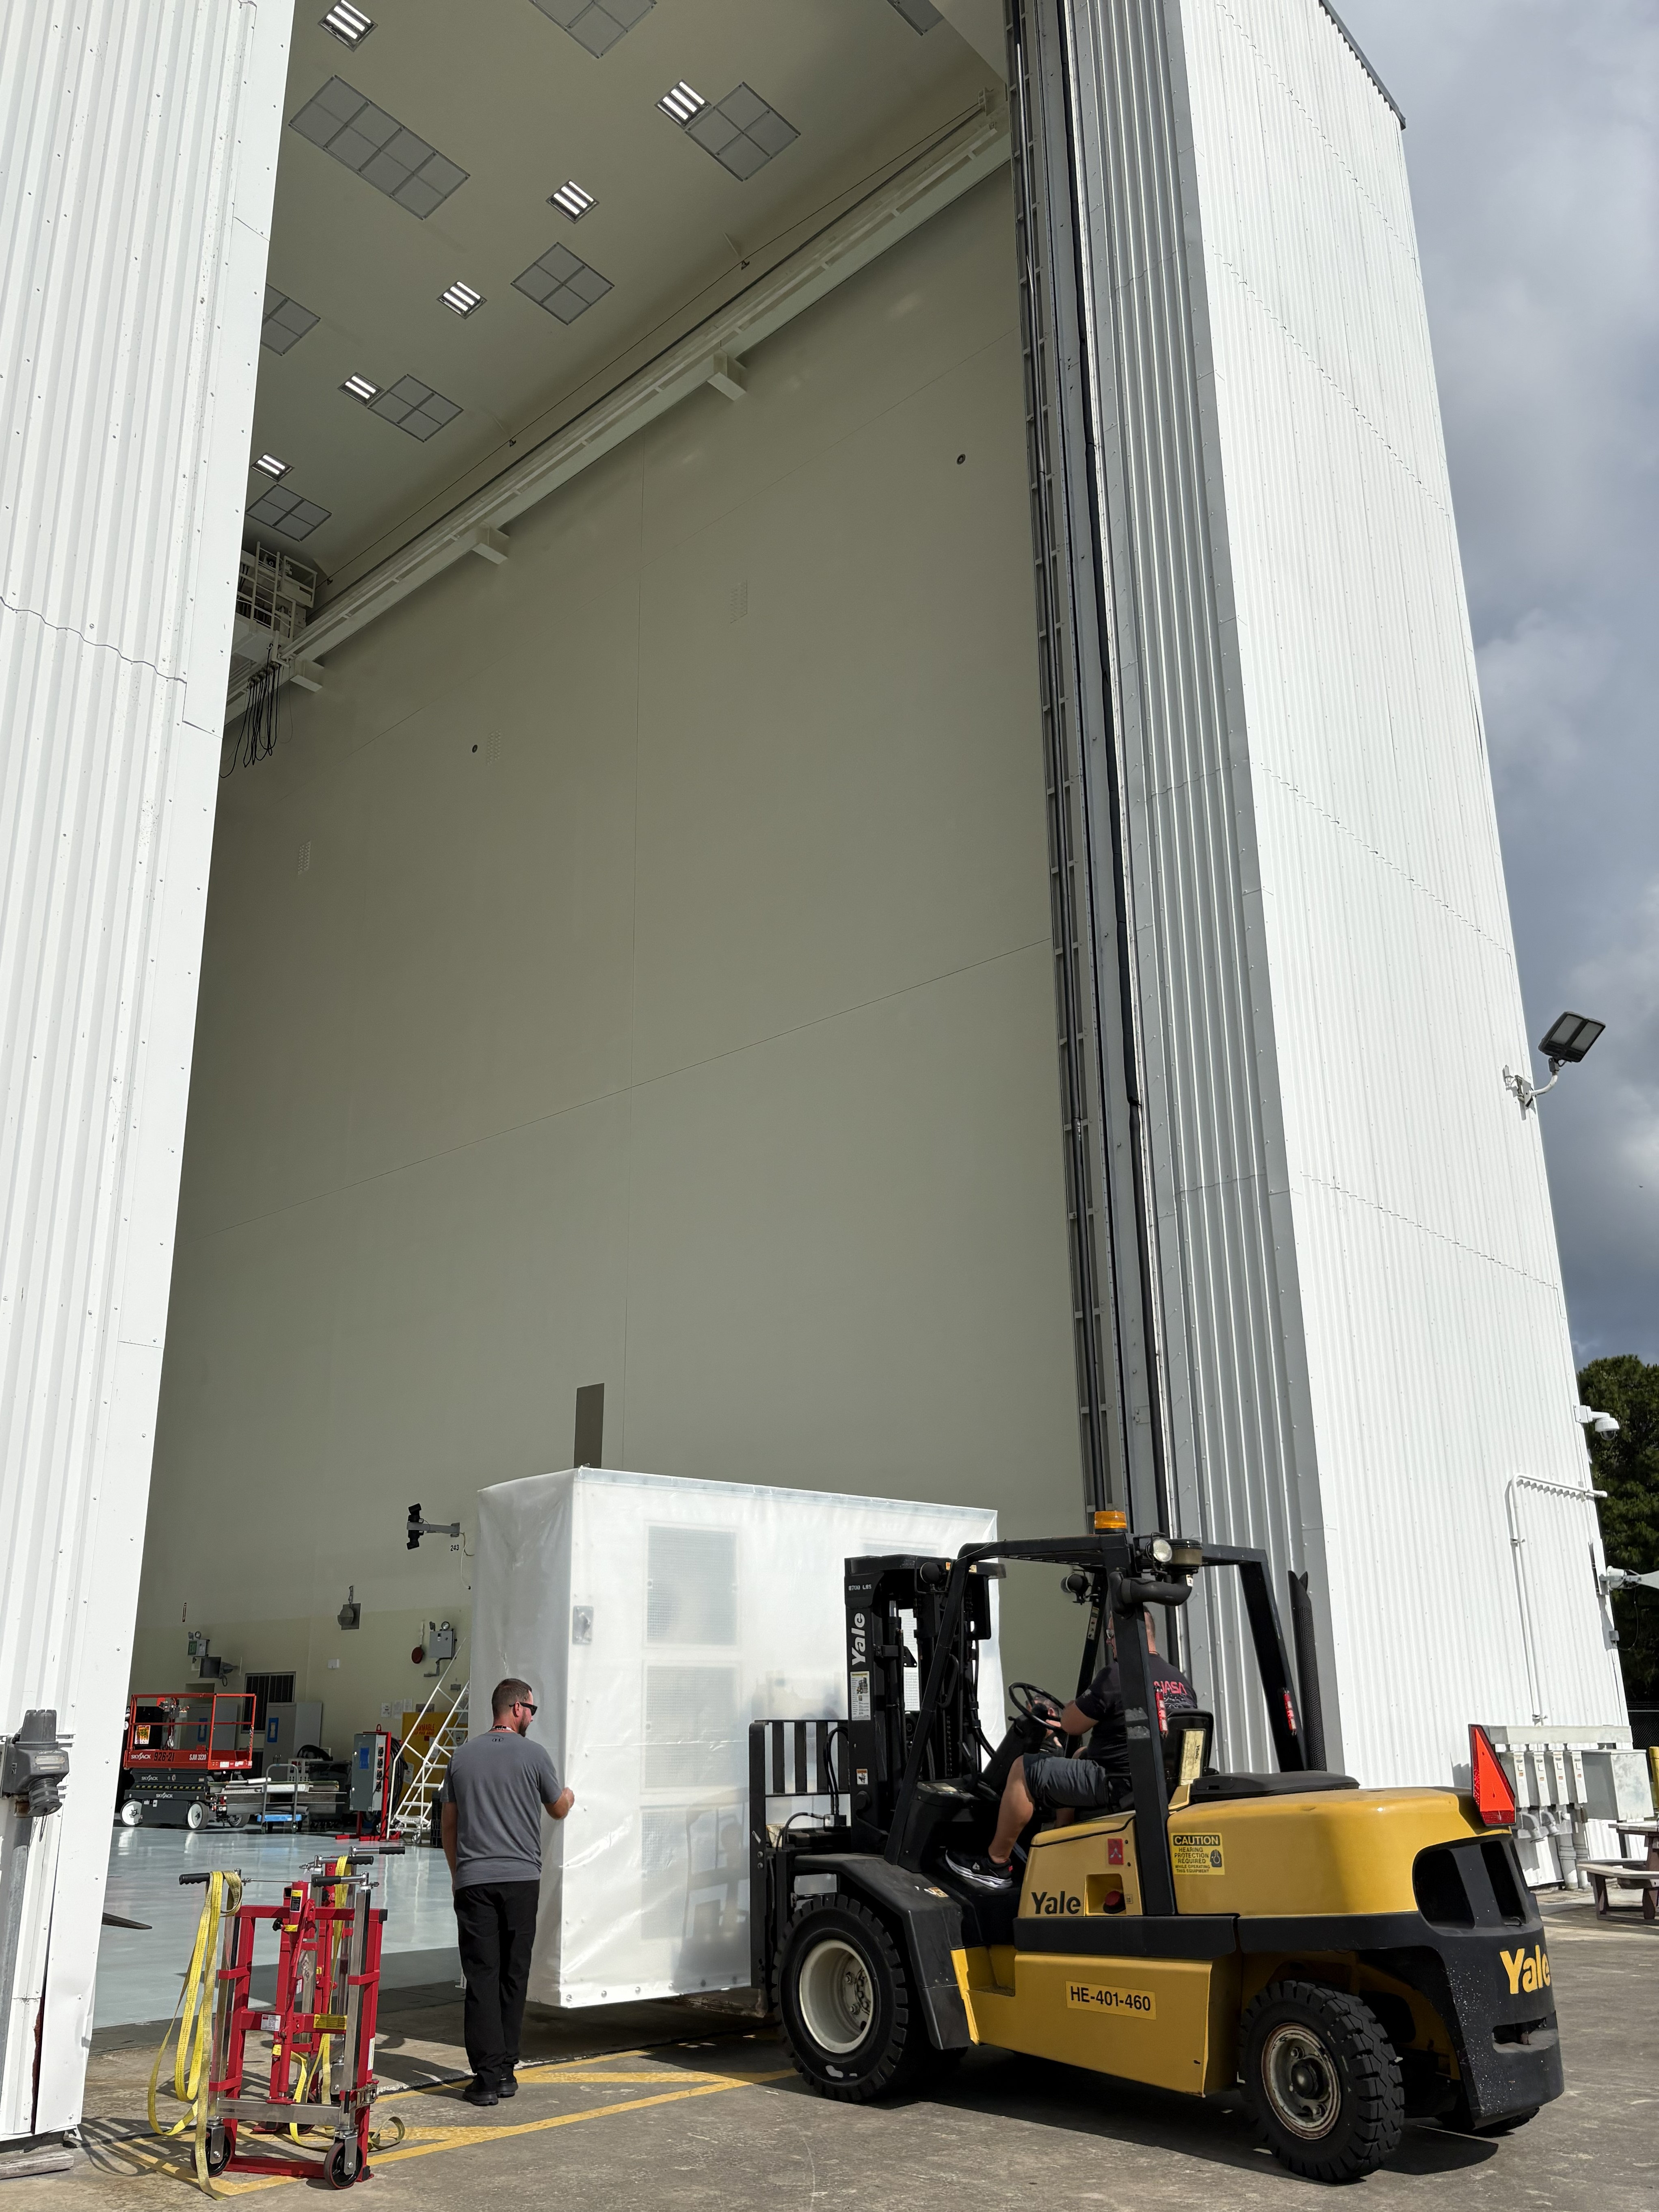
Technicians at NASA’s Payload Hazardous Servicing Facility (PHSF) at the agency’s Kennedy Space Center in Florida offloaded eight high-efficiency particulate air (HEPA) wall modules and other ground support equipment on April 27. The equipment will support launch processing of the agency’s Nancy Grace Roman Space Telescope.
Each 1,800-pound module enhances the PHSF’s clean room systems, helping meet the telescope’s stringent cleanliness requirements during its time in the facility, where the observatory will undergo key tasks such as spacecraft fueling prior to liftoff.
Roman will observe the universe in infrared light using its Wide Field Instrument and a Coronagraph Instrument technology demonstration. Its wide field of view will produce panoramic images that help astronomers investigate some of the greatest mysteries in the cosmos, including why the universe’s expansion appears to be accelerating.
By using multiple complementary techniques, Roman will chart how the universe has evolved over cosmic time and provide new insights into the nature of dark energy. Roman also will advance the study of exoplanets and map the structure and distribution of normal matter and dark matter across space and time.
Teams are targeting launch as soon as early September aboard a SpaceX Falcon Heavy rocket from Launch Complex 39A at NASA Kennedy.
Photo credit: NASA/Leejay Lockhart
NASA’s STORIE Mission to Tell Tale of Earth’s Ring Current
2026-05-01 15:31
5 min read
NASA’s STORIE Mission to Tell Tale of Earth’s Ring Current
Earth’s magnetic field is like a powerful trap. It lures electrically charged particles in space, near our planet, and snares them in an invisible, doughnut-shaped pen around Earth known as the ring current.
This captive swarm of charged particles plays an important role in how Earth reacts to changing conditions in space, called space weather, which can affect the technology we rely on, such as satellites and power grids. Yet there is still a lot we do not know about the ring current.
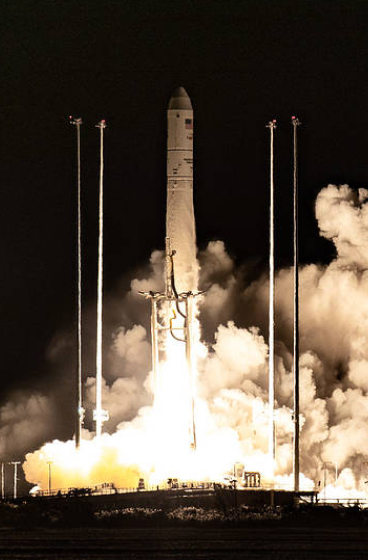
NASA is preparing to launch a mission designed to provide a unique, inside-out view of the ring current. Called STORIE (Storm Time O+ Ring current Imaging Evolution), it is scheduled to launch in May aboard the 34th SpaceX commercial resupply services mission to the International Space Station for NASA. The mission is flying as part of the Space Test Program – Houston 11 (STP-H11) payload, a partnership between the U.S. Space Force and NASA. Once it is robotically installed on the exterior of the space station (expected a few days after its arrival), STORIE will look outward at the ring current, helping scientists answer longstanding questions about how it grows and shrinks and what kind of particles it’s made of.

“These particles have important space weather impacts,” said Alex Glocer, STORIE’s principal investigator at NASA’s Goddard Space Flight Center in Greenbelt, Maryland, where the instrument was designed and constructed. “We want to understand how that trapped population is built up, and where it comes from.”
These details are especially important during solar storms, when outbursts from the Sun can lead to magnetic disturbances at Earth. Similar to Earth’s Van Allen radiation belts but filled with lower-energy particles, the ring current tends to fluctuate in size, shape, and intensity more dramatically than the radiation belts do during solar storms. Plus, in the ring current, positively charged particles and negatively charged particles flow in opposite directions, creating electrical currents. So, changes there can lead to magnetic fluctuations and induced currents on the ground, potentially affecting pipelines and power lines. The ring current can also contribute to charge buildup on the surface of Earth-orbiting satellites, which can spark spacecraft glitches. Additionally, when energy ramps up in the ring current, some of that energy gets transferred to the upper atmosphere, making it heat up, puff out, and create more drag on satellites, which can cause the spacecraft to deorbit sooner than expected.
However, it’s difficult to study the ring current directly because the particles within it are invisible. “You can’t just image them with a camera,” Glocer explained.
Instead, STORIE will scan for the glow of energetic neutral atoms, or ENAs, that are formed when charged particles trapped in the ring current manage to escape. The particles earn their freedom by stealing an electron from Earth’s outer atmosphere, known as the exosphere, and become neutral.
“Once those charged particles become neutral, they no longer feel the effects of Earth’s magnetic field, and they are no longer trapped,” Glocer said. “They can just fly off in any direction.”
By measuring the speed and direction of the ENAs, STORIE could help answer longstanding questions about the origins of particles in the ring current — whether they are supplied by a stream of particles flowing out from the Sun, known as the solar wind, or from Earth.

The STORIE team designed the instrument to pay special attention to positively charged oxygen atoms (O+) because, according to Glocer, “When you see oxygen, that comes from the atmosphere. You get very little of that from the solar wind.” If STORIE finds a lot of oxygen atoms, scientists will know the ring current is largely supplied by Earth’s atmosphere, rather than the solar wind.
Glocer and other scientists also want to find out whether the ring current’s population of charged particles build up in quick bursts or slowly and gradually. “Is it like filling a lake with the steady flow of a waterfall or a bunch of raindrops?” Glocer said.
NASA’s Goddard Space Flight Center
Previous NASA missions — such as IMAGE (Imager for Magnetopause-to-Aurora Global Exploration) and TWINS (Two Wide-angle Imaging Neutral-atom Spectrometers) — have looked at ring current ENAs before using a top-down view, which allowed them to see the whole ring current at once. However, from that perspective, ultraviolet light reflected by Earth — in the center of the ring — can interfere with the ENA observations, and the viewing geometry makes it hard to see trapped particles in the ring current near Earth’s equator.
“From STORIE’s inside-out perspective, you have Earth behind you, and you can see this trapped population near the equator that was hard for other missions to observe,” Glocer said.
Some sounding rocket experiments have gotten brief, inside-out views of the ring current in the past, but they only had a few minutes to observe and could only see a portion of the ring current during each flight. The view from STORIE will reveal one slice of the ring current at a time, but as the space station orbits Earth, STORIE will build up a complete picture of the ring current roughly every 90 minutes.
Over its six-month mission, STORIE will monitor how the ring current evolves over time and allow scientists to compare its behavior during solar storms versus when the Sun is quiet. Insights from STORIE will help us better understand how Earth responds to solar storms, improve space weather predictions, and help mitigate the effects of space weather on the technology humanity depends on.
By Vanessa Thomas
NASA’s Goddard Space Flight Center, Greenbelt, Md.
Share
Details
Related Terms
Explore More


Space Out This Summer with Variety of NASA STEM Activities
2026-05-01 14:03
Space Out This Summer with Variety of NASA STEM Activities

Summer is “Go” for launch, and NASA has a universe of ways to help you to jump in, explore, and create! Whether you prefer to spend this season fueling your creativity, going outdoors into nature, or daydreaming about your future, NASA offers ways to take your interests to the next level.
Here are some opportunities to level up your skills with NASA STEM this summer.
Rise to Stardance Challenge
From Monday, June 1, through Sept. 30, students ages 13 to 18 are invited to flex their creativity in the online Stardance Challenge, a partnership between NASA and the education non-profit Hack Club. Whether you’re into space, coding, hardware, or just love building cool things, this is your chance to work with real NASA mission data from programs like Artemis, the James Webb Space Telescope, and more.
Participants can create anything from code and apps to electronics, circuit boards, models, and simulations. Hack Club will offer peer and expert reviews, prizes, and plenty of opportunities to show off your work. Meanwhile, NASA will provide access to publicly available datasets, mission materials, multimedia, and virtual sessions with subject matter experts who can share insights on space science, engineering, and careers. Ready to start brainstorming? Visit the Hack Club: Stardance Challenge website to explore project options, check out prizes, and RSVP to get a reminder when the challenge opens

Go Behind Scenes of NASA Careers
Think NASA is only for astronauts, scientists, and tech experts? Think again. It takes a wide range of professionals and specialists to bring the nation’s aerospace goals to life. Summer is the perfect time to discover how your skills and interests could make a difference at NASA.
Connect directly with NASA experts through online events designed to spark your curiosity and help you explore real STEM career paths. These virtual sessions provide a behind‑the‑scenes look at NASA’s workforce, plus the chance to ask questions.
- Tuesday, June 2: NASA’s Career Technical Education Day at Goddard Space Flight Center dives into robotics, AI, autonomous systems, and the skilled technical careers that keep NASA missions running. Register by May 26.
- Thursday, June 11: Virtual Career Connection: Aviation Technology and Maintenance introduces you to aircraft mechanics and technicians who support NASA’s flight programs and explores pathways into aviation technology careers. Register by June 2.
Looking for more? Check out the Next Gen STEM for Careers web page for videos, articles, and more ways to learn about the variety of jobs at NASA.
Dive into NASA Research Through Citizen Science
NASA invites people of all ages and backgrounds to do NASA science as a part of real science projects that rely on volunteers. Citizen Science is a great way to make new friends, meet some scientists, and help NASA solve mysteries of the universe this summer – using just a phone or computer. You can join from anywhere, participate on your own schedule, and dive right into real research using actual mission data. Here are two examples:
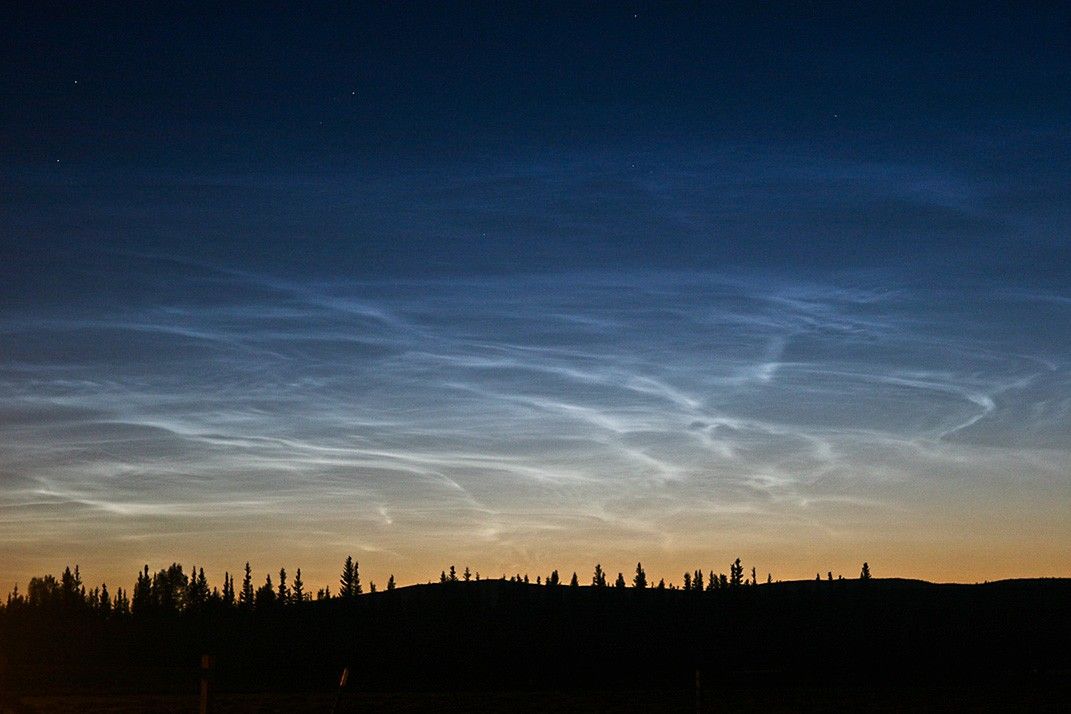
- Through Space Cloud Watch, you can help NASA study noctilucent clouds. Noctilucent means “night-shining,” and that’s exactly what they do! During summer twilight at high latitudes, these clouds catch sunlight and appear to glow even in a darkened sky. Take a photo and submit a report to help scientists track how these rare clouds are changing.
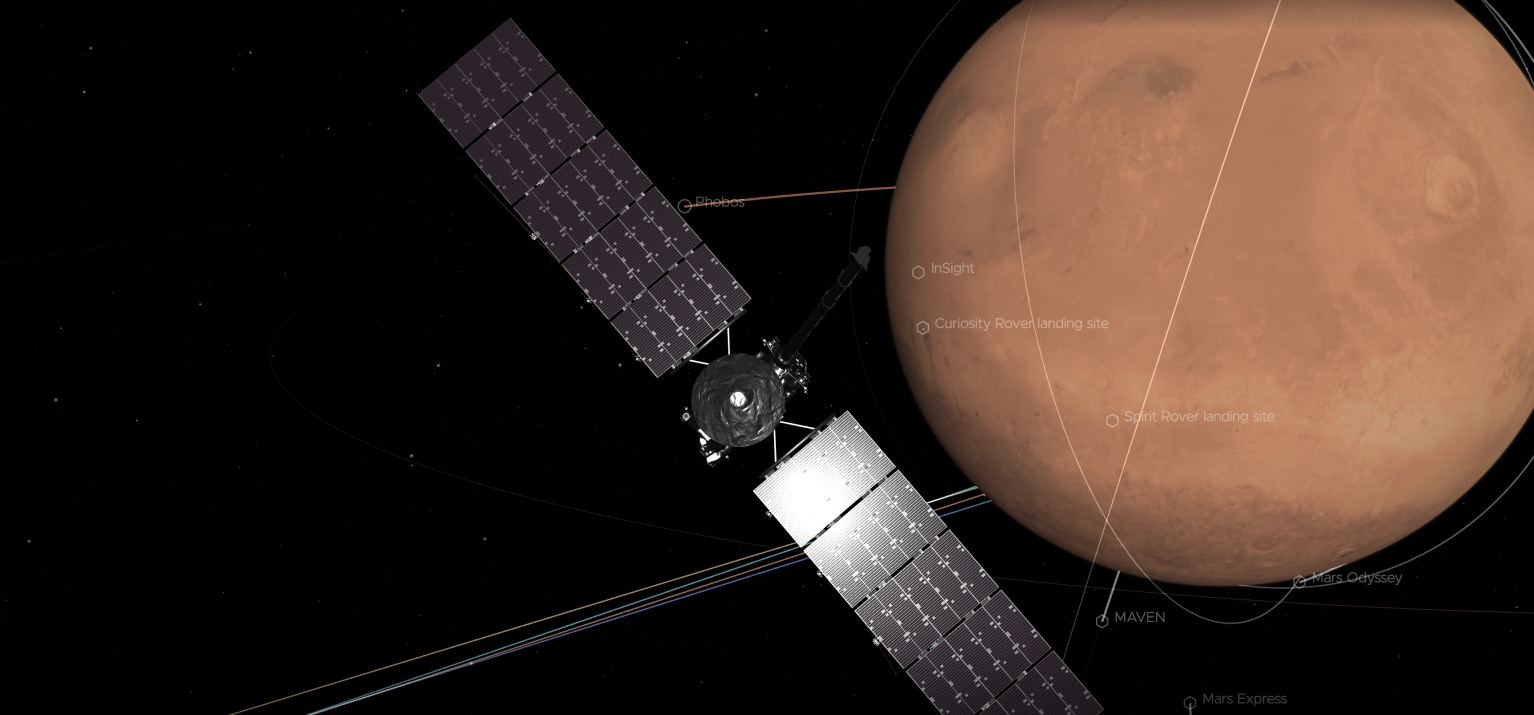
- Take your cloud‑watching to another planet with Cloudspotting on Mars, where you review real NASA images to identify clouds above the Red Planet and help scientists understand Martian weather.
Curious about what other projects you might enjoy? See all current Citizen Science opportunities available through NASA’s Science Mission Directorate.
No matter how you spend your summer – building projects like the Hack Club’s Stardance Challenge, jumping into real NASA research through citizen science, or exploring possible NASA career paths – there’s a launch pad waiting for you. And remember, NASA’s STEM Resources website is available year-round to serve as your one-stop hub for hands-on activities, videos, articles, and more to spark curiosity and fuel big ideas.

TechCrunch - Latest
Coatue has a plan to buy up land for data centers, possibly for Anthropic
2026-05-01 18:23
Pentagon inks deals with Nvidia, Microsoft, and AWS to deploy AI on classified networks
2026-05-01 16:02
Ubuntu services hit by outages after DDoS attack
2026-05-01 15:00
Musk v. Altman is just getting started
2026-05-01 14:00
People are finally using Reddit’s search
2026-05-01 12:00