📰 Trending Topics
Google News - Trending
Google News - Technology
Apple Upgrade: 20 Things to Know Before Leasing an iPhone, iPad, or Mac - MacRumors
2026-07-28 20:19
- Apple Upgrade: 20 Things to Know Before Leasing an iPhone, iPad, or Mac MacRumors
- Apple to lease iPhones, other products to users through Klarna partnership Fox Business
- Apple will now let you lease your next iPhone or Mac instead of buying it CNN
- Apple Upgrade launches in the United States Apple
- Apple plans to lease iPhones for $17.99 a month through partnership with Klarna CNBC
Galaxy Z Fold 8’s wide new design is reportedly selling faster than Samsung expected - 9to5Google
2026-07-28 16:21
- Galaxy Z Fold 8’s wide new design is reportedly selling faster than Samsung expected 9to5Google
- Samsung’s Galaxy Z Fold 8 ‘Passport’ Design Is the Next Big Smartphone Trend Bloomberg.com
- Samsung Galaxy Z Fold8 Ultra, Fold8 and Flip8: Foldables, Perfected for Every Way of Living Samsung Global Newsroom
- The smaller, cheaper Galaxy Z Fold 8 is rumored to absolutely crush the flagship Z Fold 8 Ultra PhoneArena
- Samsung CEO explains why new Galaxy foldable phones are cheaper in Korea The Korea Times
[Galaxy Unpacked July 2026] A First Look at Galaxy Watch Ultra2 and Galaxy Watch9 - Samsung Global Newsroom
2026-07-28 13:59
- [Galaxy Unpacked July 2026] A First Look at Galaxy Watch Ultra2 and Galaxy Watch9 Samsung Global Newsroom
- Galaxy Watch Ultra 2 Trail Running Test: Can It Outrun Your Garmin? CNET
- Samsung Galaxy Watch Ultra2 and Watch9: Your Health Companion on the Wrist Samsung Global Newsroom
- Deals: Galaxy Watch Ultra 2 up to $300 off, ExpertBook all-time low, Surface Pro 2-in-1 up to $470 off, more 9to5Google
- Samsung’s Galaxy Watch 9 and Ultra 2 bet big on battery The Verge
Leaks Point to Return of 4GB GPUs as AI Flash Memory Crisis Worsens - Digital Foundry
2026-07-28 12:16
- Leaks Point to Return of 4GB GPUs as AI Flash Memory Crisis Worsens Digital Foundry
- AMD Launches Radeon RX 9050 4/8 GB SKUs with First Design from ASRock TechPowerUp
- 4GB graphics cards are back The Verge
- ASRock unveils Radeon RX 9050 with 1024 cores and 8GB/4GB memory options VideoCardz.com
- AMD reveals the Radeon RX 9050—and 4GB graphics cards are back PCWorld
Android’s Find Hub app now lets you remove old Bluetooth headphones & earbuds - 9to5Google
2026-07-28 19:40
- Android’s Find Hub app now lets you remove old Bluetooth headphones & earbuds 9to5Google
- Google Find Hub finally lets you delete old devices cluttering your account Android Police
- Google finally lets Find Hub users delete their old devices Android Authority
- Google Find Hub Finally Lets You Delete Old Headphones and Accessories Android Headlines
NASA - Breaking News
Sizing Up the Sargassum Belt
2026-07-29 04:00
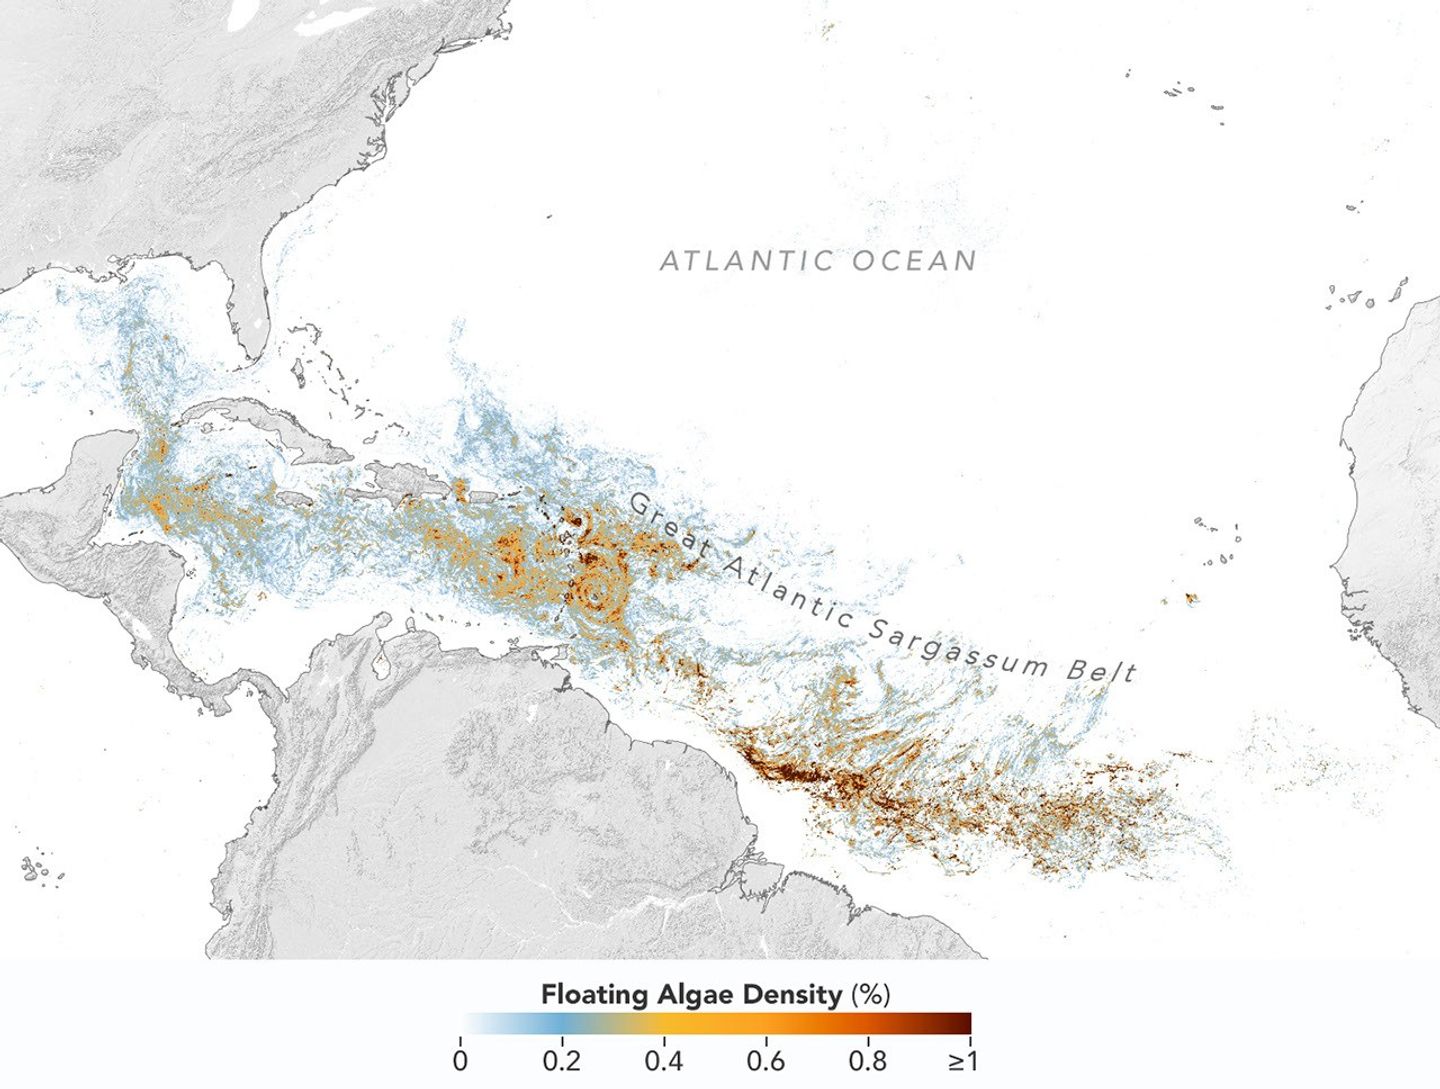
Sargassum, a type of brown floating algae, has shifted its range in recent decades, thinning out in the North Atlantic’s Sargasso Sea while proliferating in the tropical Atlantic. That trend, underway since 2011, continued in 2026 as the algae, commonly known as a type of seaweed, reached its annual peak in June across a stretch of ocean known as the Great Atlantic Sargassum Belt.
The belt’s Sargassum abundance in June 2026 made it the second-highest Sargassum year in the satellite record, slightly behind 2025, according to scientists at the University of South Florida (USF) College of Marine Science. Regionally, the Caribbean Sea and the Gulf of America (Gulf of Mexico) both hit record highs, according to USF’s June 2026 Sargassum outlook. The western and eastern Caribbean saw 3.6 and 9 million metric tons, respectively, while the Gulf saw 5 million metric tons—nearly double its previous record, also set in 2025.
“The belt is a basin-scale phenomenon that can have devastating local-scale impacts throughout the Caribbean and Gulf, and satellite observations are the only method that captures both scales on a daily basis,” said Brian Barnes, a marine scientist at the Optical Oceanography Laboratory at USF. “The tracking done by our lab helps communities know the current extent of Sargassum and prepare for what’s to come.”
In moderate amounts in the open ocean, Sargassum provides habitat for turtles, invertebrates, fish, and birds, and adds oxygen to the water through photosynthesis. But too much of it near shore can tangle and suffocate marine life, and mats that sink can smother corals and seagrasses. On beaches, decomposing Sargassum releases hydrogen sulfide, a rotten-egg-smelling gas that’s a potential problem for both ecosystems and tourism.
The map above shows Sargassum density in the tropical Atlantic Ocean in June 2026. Red and orange areas are where Sargassum densities were the highest. Note that although the “belt” appears continuous, discrete Sargassum mats are scattered across the ocean surface. The map is based on satellite measurements of how much of the ocean surface was covered by the seaweed, averaged per pixel across all observations made in June by the OCI (Ocean Color Instrument) on NASA’s PACE (Plankton, Aerosol, Cloud, ocean Ecosystem) satellite.
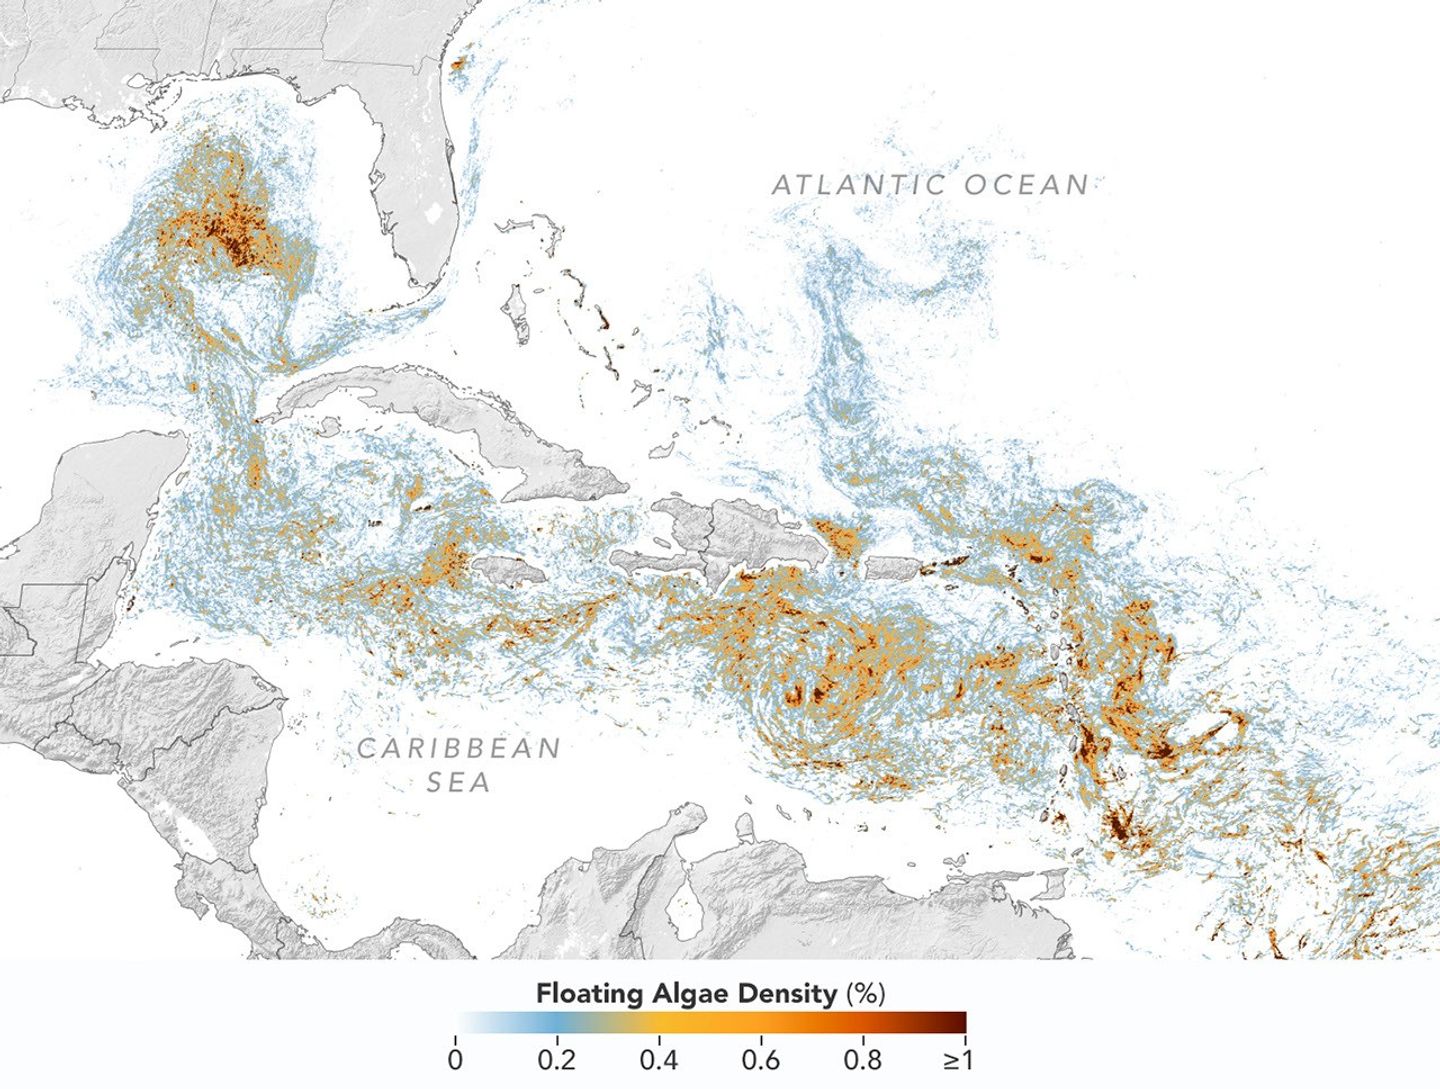
Ocean currents and winds shape the Sargassum belt, which, despite the patchiness, stretches nearly continuously from West Africa to the Gulf and holds a fairly steady “width” from the western tropical Atlantic westward, explained Chuanmin Hu, also an optical oceanographer at USF. The ocean currents have also spared Florida’s west coast from inundation this summer, while delivering large amounts of seaweed to the Florida Keys and the state’s east coast. The bulk of the Sargassum, however, is visible in the Caribbean Sea, shown in detail above, where problems associated with inundation have been more severe, Hu said.
Data for the maps were provided by Lin Qi, an oceanographer at NOAA’s Center for Satellite Applications and Research, who has been working to generate Sargassum maps based on data from PACE, which was launched in February 2024. The work extends that of Qi and colleagues at USF’s Optical Oceanography Laboratory. This team first developed Sargassum detection techniques using MODIS (Moderate Resolution Imaging Spectroradiometer) on NASA’s long-running Terra and Aqua satellites and VIIRS (Visible Infrared Imaging Radiometer Suite) on the NOAA-20 satellite—data that have been a key component of USF’s Sargassum Watch System and of research into the seaweed’s longer-term trends.
Satellites detect Sargassum by its signals in reflected sunlight. Because of its plant structure and chlorophyll pigments, Sargassum reflects more near-infrared light than water. Scientists flag pixels where the reflectance spikes above the levels produced by plain seawater, and then they use the strength of this spike to estimate Sargassum density, which refers to the fraction of ocean surface covered by the seaweed in each pixel. Density estimates can then be converted into biomass, or the total weight of Sargassum present within a pixel, which is how the longer-term trends in the chart below are tracked.
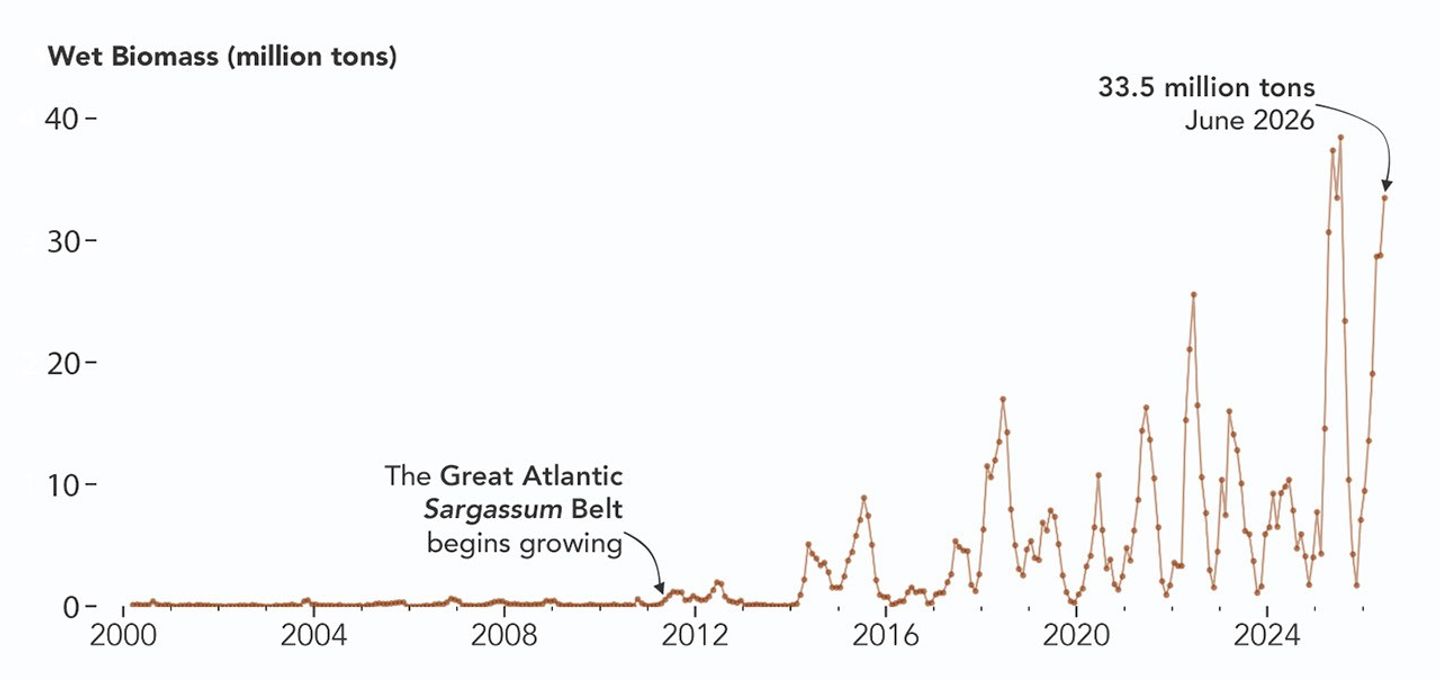
The chart above uses the continuous MODIS record since March 2000 to show how Sargassum biomass across the Great Atlantic Sargassum Belt has changed through June 2026. Notice the uptick beginning around 2011, when the belt was first developing, and the seasonal dips in winter and peaks in spring and summer. The record high in July 2025 stands out, followed by the quick rise in early 2026—especially in the first four months of the year—that culminated in the year’s peak in June. More recent observations, not yet reflected in the chart, indicate Sargassum biomass declined through the following month of July.
“Since the initial appearance of the Great Atlantic Sargassum Belt in 2011, the total Sargassum amount in the Atlantic Ocean has increased substantially, more than doubling every five years,” Hu said. He added that the exact mechanism is still being investigated, but it’s possibly related to ocean warming, multiple nutrient sources, and the fact that large Sargassum mats attract other organisms—such as nitrogen-fixing bacteria—that can supply additional nutrients to sustain further growth.
Alongside data from MODIS and VIIRS, OCI data from PACE now feeds into the Sargassum Watch System’s near-real-time daily and weekly composite maps. A recent study of the central-west Atlantic led by Qi, spanning May through August 2024, found that OCI offers several advantages over its predecessors, observing more of the ocean and detecting Sargassum with greater sensitivity.
Hu noted that the added pixels from OCI can improve near-real-time monitoring and analyses of short-term fluctuations. And its higher sensitivity, he said, will also lead to improved maps during winter months, “thus helping understand Sargassum changes over time.”
Additionally, the study’s authors found that OCI’s hyperspectral capability makes it the only sensor able to spectrally discriminate Sargassum pixels across the Atlantic Ocean “without ambiguity,” adding confidence to the interpretation of detected image features—especially in parts of the Atlantic where another type of floating algae, Trichodesmium, has been reported.
“I think I can speak for all project members, past and present, in sharing how rewarding it is to see the promise of PACE’s advancements come to life,” said Jeremy Werdell, PACE project scientist at NASA’s Goddard Space Flight Center. “OCI has started a true renaissance in aquatic ecosystem monitoring from space.”
NASA Earth Observatory maps and chart by Lauren Dauphin, using PACE and MODIS data courtesy of Lin Qi (NOAA), and Brian Barnes and Chuanmin Hu (University of South Florida, Optical Oceanography Laboratory). Story by Kathryn Hansen.
References & Resources
- NASA Earth Observatory (2023, April 8) A Massive Seaweed Bloom in the Atlantic. Accessed July 28, 2026.
- NASA Earth Observatory (2019, July 9) Scientists Discover the Biggest Seaweed Bloom in the World. Accessed July 28, 2026.
- Qi, L., et al. (2026) Hyperspectral OCI/PACE observations of the Atlantic Sargassum. Remote Sensing of Environment, 334, 115185.
- University of South Florida, College of Marine Science (2026, June 30) Outlook of 2026 Sargassum blooms. Accessed July 28, 2026.
- University of South Florida, Optical Oceanography Laboratory (2026, July) Satellite-based Sargassum Watch System (SaWS). Accessed July 28, 2026.
- Zhang, Y., et al. (2025) Dramatic decline of Sargassum in the north Sargasso Sea since 2015. Nature Geoscience, 18, 1266–1272.
You may also be interested in:
Stay up-to-date with the latest content from NASA as we explore the universe and discover more about our home planet.
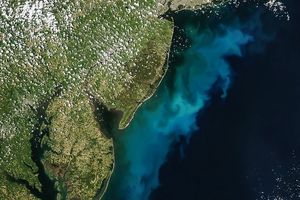
Something is brewing in shallow waters offshore of Delaware, New Jersey, Maryland, and Virginia.

Phytoplankton added a milky blue hue to the waters of the Black Sea and nearby waterways in spring and summer…
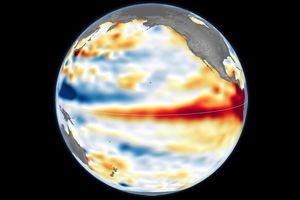
Satellite observations of sea surface height indicated that the 2026 event continued to strengthen in early June.




Smoke Blankets Oregon
2026-07-28 04:01

Dry thunderstorms that popped up over the Cascade Range on the evening of July 15, 2026, peppered Oregon and Washington with thousands of lightning strikes as they moved east across the states. By the following day, NASA satellites had begun to detect large numbers of wildland fires burning throughout central and eastern Oregon.
Though initially small, these blazes strengthened as they were fanned by gusty winds and raced through landscapes parched by extreme drought and baking in summer heat. When NASA’s Aqua satellite captured the image shown above on the afternoon of July 26, smoke poured northeast from dozens of large fires that had collectively charred hundreds of square miles. The fires produced a blanket of haze, prompting state officials to issue air quality advisories for eastern Oregon.
Many communities faced evacuation orders as more than 10,000 firefighters battled wildfires throughout the state. On the day the image was captured, the largest active fires were the Hay Creek Complex, Brewer, Big Grass, Akawa Butte, and Powder River fires. Several of these blazes were less than 5 percent contained, according to the National Interagency Fire Center. State officials invoked Oregon’s Emergency Conflagration Act to protect communities as they responded to particularly threatening fires such as the Shingle, Bench, Beachcomb, and Second Flat fires.
Government satellite data are part of a global system of observations used to track fire behavior and analyze emerging trends. Among the real-time wildfire monitoring tools that NASA makes available are FIRMS (Fire Information for Resource Management System), the Worldview browser, and the Fire Event Explorer.
As of July 27, 2026, fires in Oregon had burned more than one million acres, according to news outlets. Meanwhile, the National Interagency Fire Center reported that fires had burned more than 4 million acres across the United States. The 10-year average (2016-2025) for this point in the season is 3.4 million acres.
NASA Earth Observatory image by Michala Garrison, using MODIS data from NASA EOSDIS LANCE and GIBS/Worldview. Story by Adam Voiland.

References & Resources
- Central Oregon Fire Info (2026, July 27) The Source For Comprehensive Fire, Health, And Air Quality Information In Central Oregon. Accessed July 27, 2026.
- KGW8 (2026, July 27) Latest updates on Oregon wildfires: Fires burn more than 1 million acres across the state. Accessed July 27, 2026.
- NASA Earthdata (2026) Wildfires. Accessed July 27, 2026.
- National Interagency Fire Center (2026) Oregon. Accessed July 27, 2026.
- Northwest Interagency Coordination Center (2026, July 27) Official Fire Information. Accessed July 27, 2026.
- OPB (2026, July 27) Oregon wildfires explode over weekend with no signs of slowing down. Accessed July 27, 2026.
- Oregon State Fire Marshal (2026, July 27) OSFM Wildfire Info. Accessed July 27, 2026.
- Oregon.gov (2026, July 26) Current wildfire info. Accessed July 27, 2026.
- Oregon Smoke Information (2026, July 27) Air quality advisory for Eastern Oregon and parts of Central Oregon. Accessed July 27, 2026.
- Oregon Department of Forestry (2026, July 27) Latest News. Accessed July 27, 2026.
- U.S. Drought Monitor (2026, July 21) Oregon. Accessed July 27, 2026.
You may also be interested in:
Stay up-to-date with the latest content from NASA as we explore the universe and discover more about our home planet.
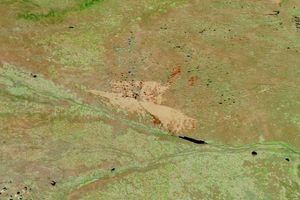
Dry, warm, and windy conditions across the U.S. Great Plains led to extreme fire activity in March 2026.
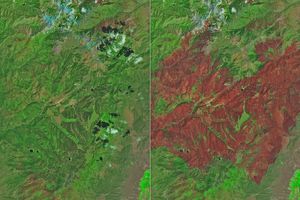
The blaze burned more than 150 square miles and swept through parts of a ski resort.

Firefighters are battling two destructive blazes in the southern part of the state as drought grips the U.S. Southeast.
NASA Astronaut Chris Williams to Discuss Space Station Mission
2026-07-27 18:49
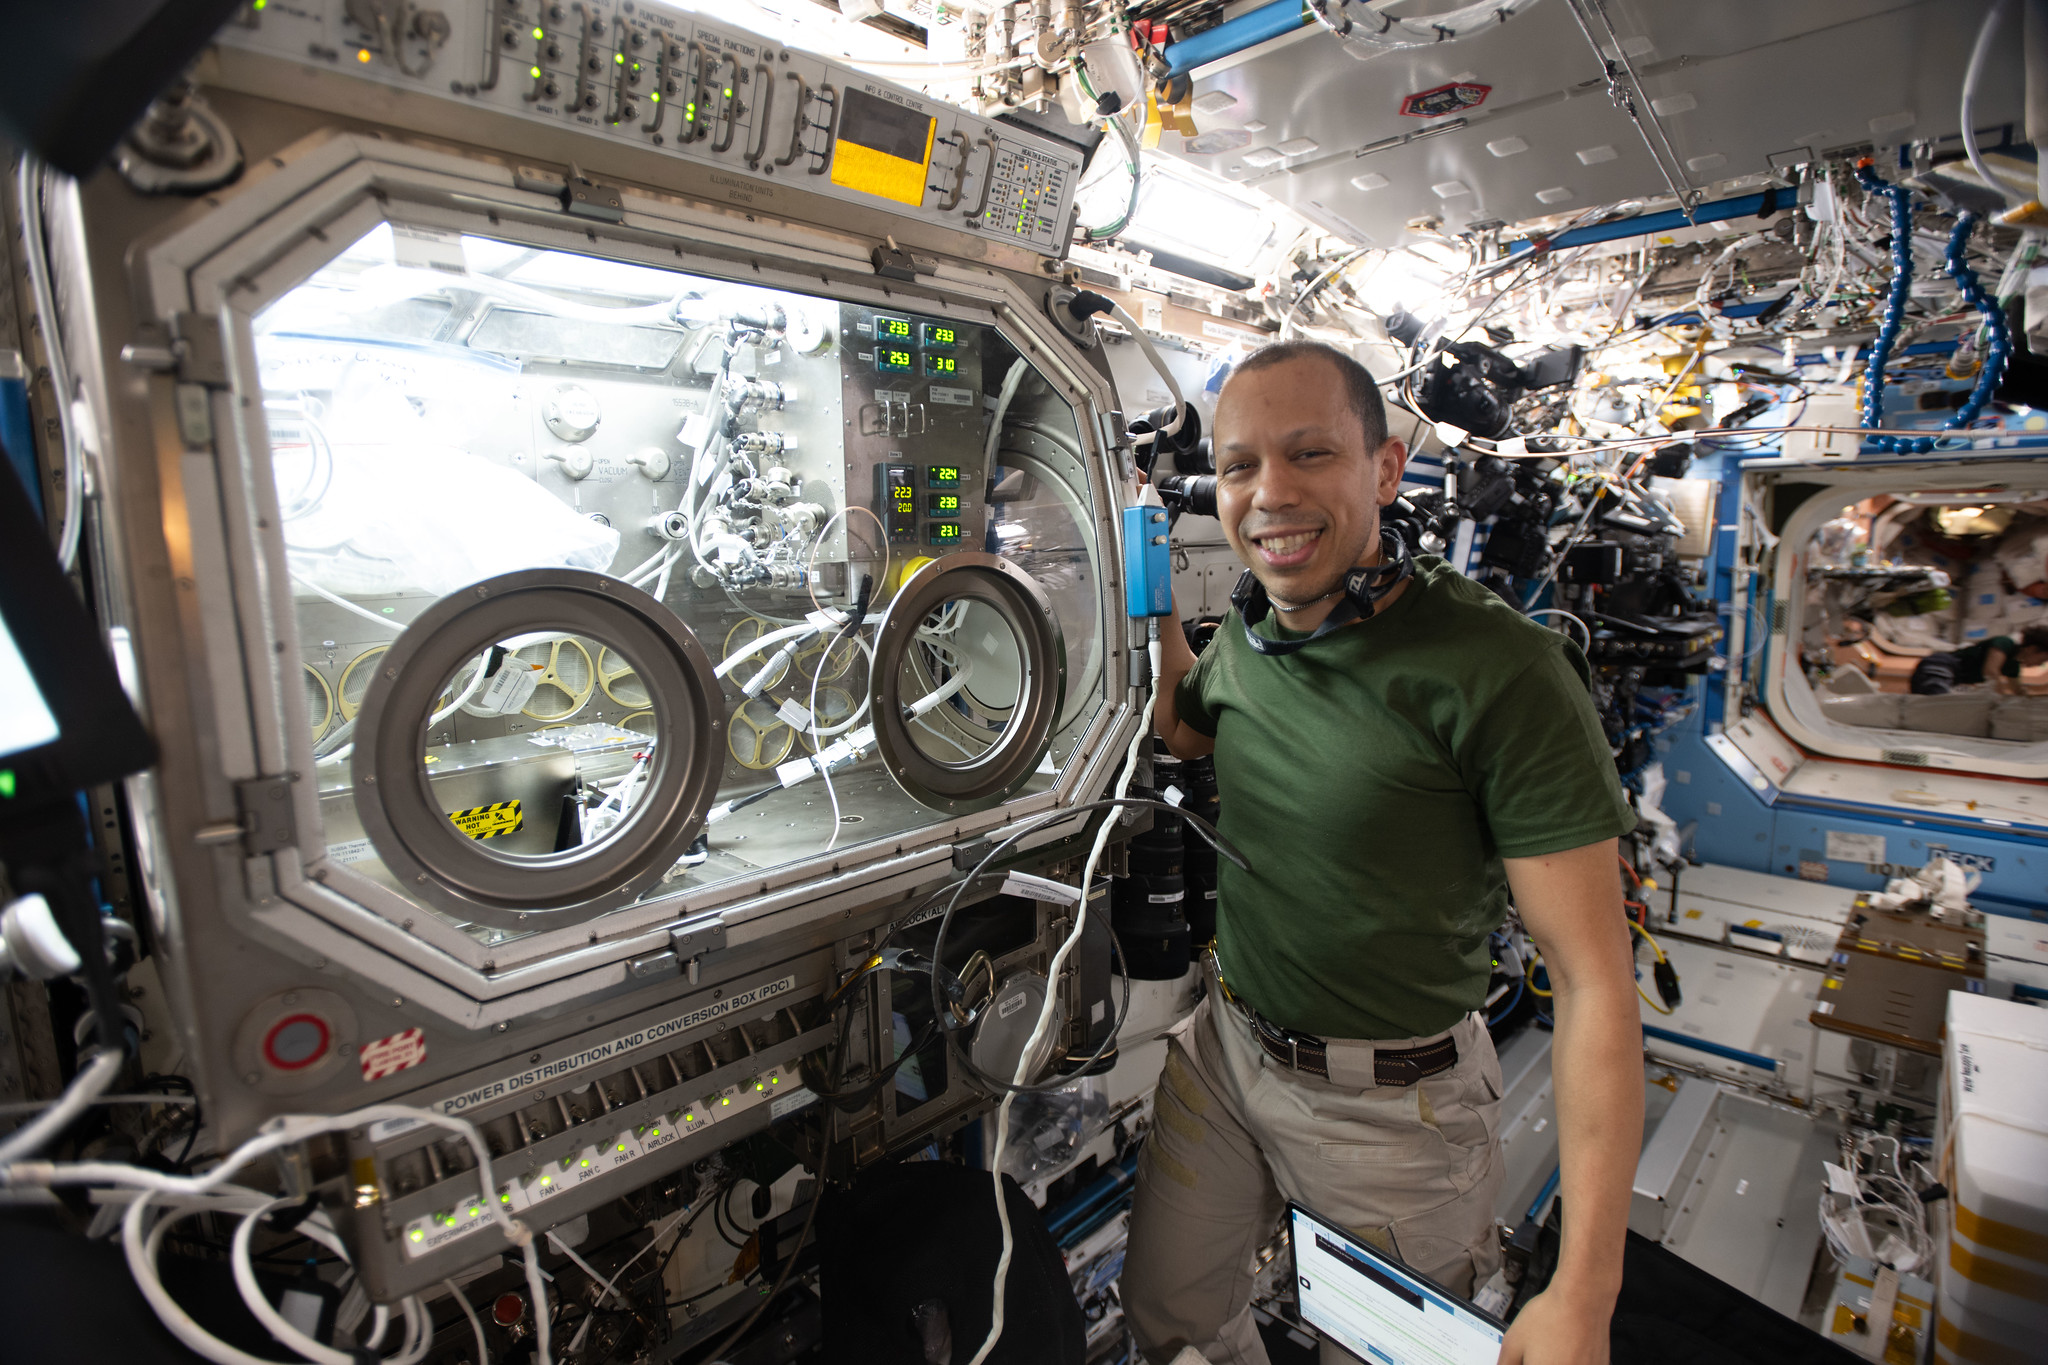
NASA astronaut Chris Williams will recap his recent eight-month mission aboard the International Space Station during a news conference at 2:45 p.m. EDT Tuesday, Aug. 4, from the agency’s Johnson Space Center in Houston.
NASA will stream this event live through a variety of platforms. Learn where to watch online:
United States-based media interested in attending in person must contact the NASA Johnson newsroom no later than 5 p.m., Friday, July 31, at jsccommu@mail.nasa.gov.
Media wishing to participate by phone must contact the Johnson newsroom no later than two hours before the start of the event. To ask a question by phone, media must dial into the news conference no later than 15 minutes prior to the start of the call. NASA’s media accreditation policy is available online.
Williams returned to Earth on July 26, after logging 241 days as an Expedition 73/74 flight engineer during his first spaceflight. He returned along with Roscosmos cosmonauts Sergey Kud-Sverchkov and Sergei Mikaev, completing 3,856 orbits of the Earth over the course of their more than 102-million-mile journey. They also saw the arrival of six visiting spacecraft and the departure of eight.
During his mission, Williams supported a wide range of scientific investigations and technology demonstrations. He helped advance research for new cancer treatments and improved in-space manufacturing of materials used in high-performance computers and electronics. Williams also completed two spacewalks to prep for space station power system upgrades and to replace a faulty joint on the Canadarm2 robotic arm. The crew’s work aboard the space station helps improve life on Earth and prepare for future human missions to the Moon and Mars.
To learn more about International Space Station research, operations, and its crews, visit:
-end-
Joshua Finch
Headquarters, Washington
202-358-1100
joshua.a.finch@nasa.gov
Anna Schneider
Johnson Space Center, Houston
281-483-5111
anna.c.schneider@nasa.gov
NASA Science Soars During August Total Solar Eclipse
2026-07-27 18:01
6 min read
NASA Science Soars During August Total Solar Eclipse
Each time the Moon covers the Sun during a total solar eclipse — darkening daytime skies and briefly revealing the Sun’s ethereal outer atmosphere, the corona — it presents new opportunities to better understand our star and its influence on Earth.
On Wednesday, Aug. 12, as the next total solar eclipse sweeps over Greenland, Iceland, and Spain, NASA-funded science teams will be chasing the Moon’s shadow with a high-altitude jet and scientific balloons to investigate the Sun’s dynamics and how the temporary darkening of our skies affects our atmosphere.
“From our unique perspective on Earth during a total solar eclipse, scientists can study the Sun’s corona in a way we can’t from anywhere else in the solar system,” said Kelly Korreck, eclipse program manager at NASA Headquarters in Washington. “The Sun impacts our daily life, satellites, and astronauts in space, and we can take advantage of this moment to advance our understanding of that influence.”
High-flying jet to record solar dynamics
Soaring in the nose cone of NASA’s WB-57 high-altitude research aircraft is a suite of four cameras to take high-resolution images of the corona in several different wavelengths of visible and infrared light. Part of an instrument developed by the NASA Scientifically Calibrated In-Flight Imagery (SCIFLI) team at NASA’s Langley Research Center in Hampton, Virginia, the cameras will capture at least 20 images per second, recording structures, outflows, and rapid changes in the corona during the total solar eclipse.
With these images, scientists hope to learn more about the formation of prominences (solar material that gets suspended above the Sun’s surface), better understand the corona and how it gets heated to nearly a million degrees, and investigate how material in the corona and the solar wind are related, which flows out from the Sun across the solar system.

By chasing the Moon’s shadow, the jet will extend how long the cameras can observe the corona. On the ground, the longest anyone will be able to see the corona is two minutes and 18 seconds. But flying along the eclipse path at 460 miles per hour, the jet’s view of the corona will last nearly three minutes.
NASA’s WB-57 will fly at 50,000 feet, above any clouds that might obscure the view of the corona from the ground. The altitude also allows the cameras to observe some infrared wavelengths that get absorbed by the lower atmosphere before reaching the ground, and the corona only has been observed in those wavelengths a few times before.

The instrument, called SCIFLI Multispectral Airborne Imager, or SAMI, also flew on a WB-57 during the total solar eclipse on April 8, 2024, providing valuable imagery and information about the corona. However, the study’s principal investigator, Amir Caspi of the Southwest Research Institute in Boulder, Colorado, says each total solar eclipse provides new opportunities to learn more about the corona.
“The Sun is always changing,” Caspi said. “Every eclipse is different. So we could see things we didn’t see before. And we learn from each eclipse how to better observe the next one.”
Caspi’s team also is making some enhancements for the 2026 campaign based on lessons learned in 2024. For example, the team will adjust exposure times to better capture bright features that were overexposed in 2024 imagery. They will also leverage software developed since 2024 to process and analyze the data sooner than before.
The experiment is funded by NASA’s Heliophysics Low Cost Access to Space Program.
Balloons to watch atmospheric changes
When a total solar eclipse suddenly turns daytime skies dark, our atmosphere changes in ways we don’t yet fully understand.
The NASA-supported Nationwide Eclipse Ballooning Project, led by Angela Des Jardins at Montana State University, is sending students from several U.S. universities to Iceland and Spain to launch scientific balloons before, during, and after the eclipse to better understand those changes.

In Iceland, two teams will launch a total of 80 balloons starting 18 hours before the eclipse until eight hours afterward to study how the eclipse affects Earth’s “boundary layer,” the part of the atmosphere that touches the ground. The thickness of the boundary layer changes depending on factors such as surface temperature and moisture in the air.
Previous balloon flights during solar eclipses in October 2023 and April 2024 showed that the boundary layer collapsed, or decreased in thickness, in locations with clear skies but not where there were cloudy skies. Scientists wonder whether that will be different in Iceland in 2026. Changes in the boundary layer are driven by the day-night cycle. However, in Iceland in August, the days are long and nights are short, so the nighttime influences might not be as strong as in 2023 or 2024.
“Will this eclipse be able to collapse the boundary layer?” said Matthew Bernards, a chemical engineering professor at the University of Idaho, who leads one of the Iceland teams.
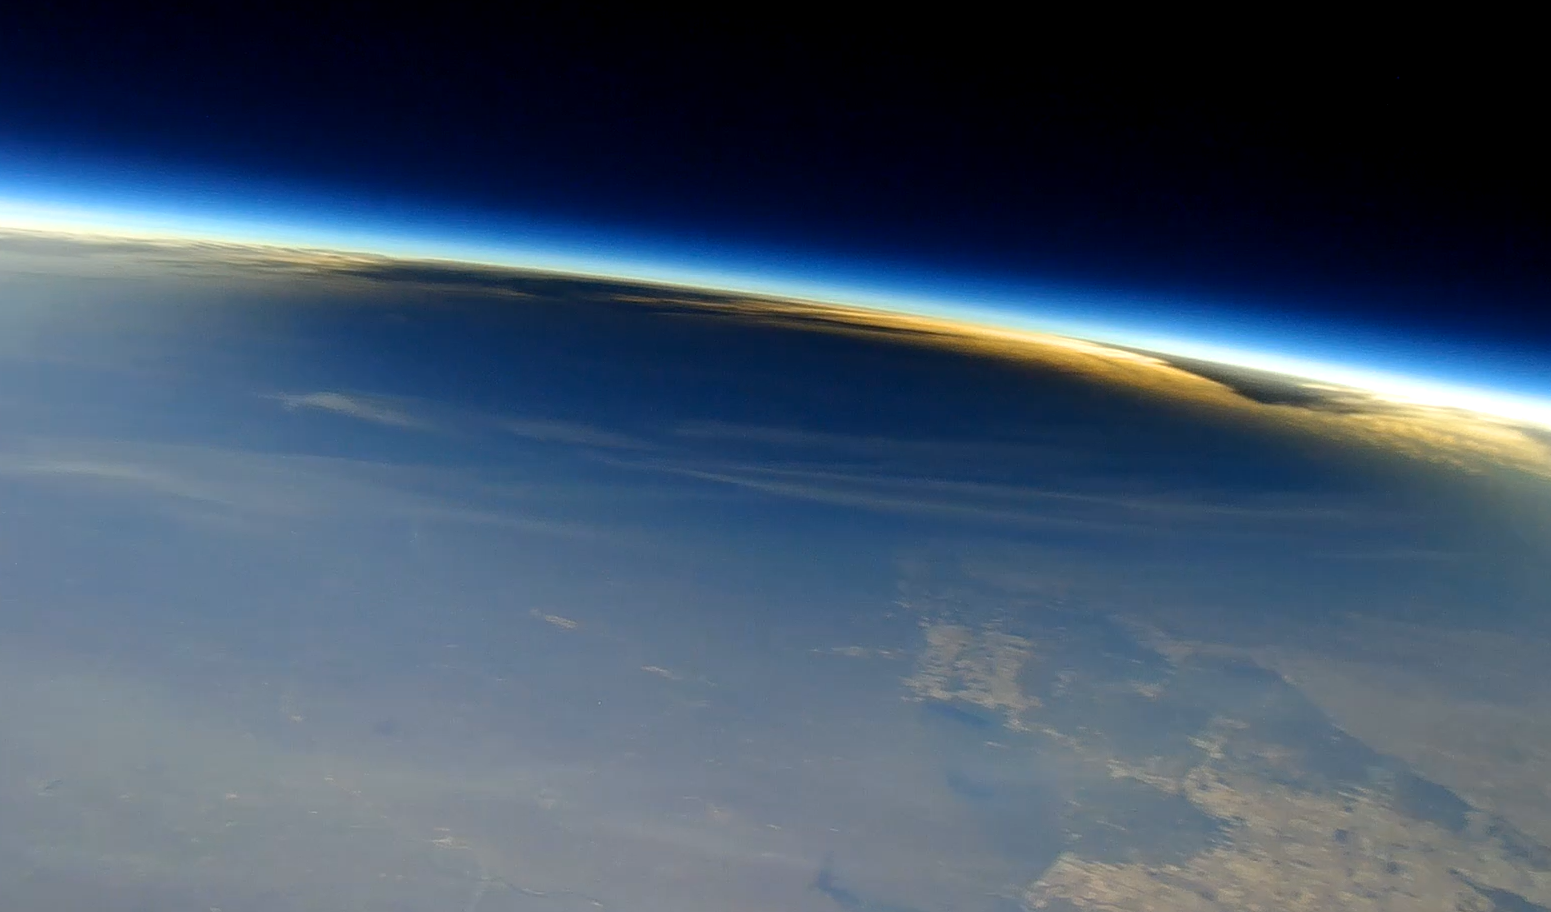
In Spain, three balloon teams will launch a total of six balloons with 360-degree cameras to image the eclipse shadow from above. These balloons also will include instruments designed to measure levels of ozone in the atmosphere, which requires sunlight to form. Similar balloon experiments showed that ozone decreased during totality in April 2024. Scientists wonder whether there will be differences with this eclipse, particularly since it happens at a later time of day and during a different season.
Follow along
While the total solar eclipse won’t be visible in the U.S., some parts of the country will be able to see a partial solar eclipse. Learn more about where to see the eclipse and how to view it safely.
by Vanessa Thomas
NASA’s Goddard Space Flight Center, Greenbelt, Md.
Lee esta historia en español aquí.
Share
Details
Related Terms
Explore More


NASA Astronaut Chris Williams Returns to Earth
2026-07-27 16:48

NASA astronaut Chris Williams is all smiles in this July 26, 2026, photo taken shortly after he landed with Expedition 74 Roscosmos cosmonauts Sergey Kud-Sverchkov, and Sergei Mikaev in Kazakhstan. This was Williams’ first mission.
Williams spent eight months aboard the International Space Station, where he supported a wide range of scientific investigations and technology demonstrations. He also completed two spacewalks to prep for space station power system upgrades and to replace a faulty joint on the Canadarm2 robotic arm.
Image credit: NASA/Bill Ingalls
TechCrunch - Latest
Cyera agrees to acquire Oasis Security for $1B to safeguard proliferating AI agents
2026-07-29 00:09
Bot-detection startup Spur nabs $200M from Insight
2026-07-28 21:29
MCP startup Runlayer accuses Rippling of stealing its product idea
2026-07-28 20:45
Sam Altman is ready to decelerate
2026-07-28 20:17
Ozlo’s Sleepbuds 2 build on Bose’s sleep earbud legacy
2026-07-28 19:09


