📰 Trending Topics
Google News - Trending
Google News - Technology
Everything announced at Microsoft’s Surface Laptop Ultra event - The Verge
2026-10-08 07:02
- Everything announced at Microsoft’s Surface Laptop Ultra event The Verge
- MSFT Stock On 4-Day Winning Streak: Microsoft Takes On Apple's Macs With Nvidia-Powered Surface Ultra, More On-Device AI Yahoo Finance
- Pre-order our most powerful Surface devices ever Windows Blog
- Microsoft event debuts new AI-friendly hardware and Windows changes Ars Technica
- Microsoft to sell $2,599 Surface Laptop Ultra containing Nvidia AI chip CNBC
Moment Nasa scientist Margaret Hamilton receives presidential medal of honour - BBC
2026-10-08 07:08
- Moment Nasa scientist Margaret Hamilton receives presidential medal of honour BBC
- Margaret Hamilton, computing pioneer who led software development for the Apollo program, dies at 90 MIT News
- Margaret Hamilton, whose software helped land Apollo astronauts on the moon, has died CNN
- Margaret Hamilton, Who Developed Software for First Moon Landing, Dies at 90 WSJ
- Margaret Hamilton, pioneering computer scientist for Apollo program, dies at 90 CBS News
Red Magic 12 Pro+ full design revealed ahead of October 15 launch - Gizmochina
2026-10-08 04:33
- Red Magic 12 Pro+ full design revealed ahead of October 15 launch Gizmochina
- RedMagic 12 Pro+ design and color options revealed ahead of launch - GSMArena.com news GSMArena.com
- Red Magic 12 Pro+ reservations open ahead of October 15 launch Gizmochina
- RedMagic 12 Pro+ Reservations Are Now Open Gizchina.com
- Red Magic 12 Pro+ Design: Flush Cameras and Transparent Backs Nokiamob
Amazon US Prime Deals: the Google Pixel 11 Pro is $250 off - GSMArena.com news - GSMArena.com
2026-10-07 18:12
- Amazon US Prime Deals: the Google Pixel 11 Pro is $250 off - GSMArena.com news GSMArena.com
- The Pixel 11 Pro and Pro XL phones are $250 off The Verge
- At $599 During Prime Day, the Google Pixel 10 Is Still Worth the Upgrade PCMag
- Put a Google Pixel 11 Smartphone in Your Pocket for Up to $300 Off This Prime Day CNET
- Google Pixel 11 Pro Review: Is This THE Phone For Content Creators? SAYS
Gurman: OLED MacBook Pro Won't Be 'Significantly Thinner' - MacRumors
2026-10-08 08:29
- Gurman: OLED MacBook Pro Won't Be 'Significantly Thinner' MacRumors
- Apple’s ‘lighter’ touchscreen MacBook Pro might not be much thinner after all Macworld
- Apple MacBook Pro Release Schedule: What To Expect When Forbes
- New MacBook Pro redesign gets exciting launch timing update 9to5Mac
- Redesigned MacBook Pro will reportedly include these three changes 9to5Mac
NASA - Breaking News
APOD: 2026 October 8 – The Saturn System Smörgåsbord
2026-10-08 04:05
APOD
Astronomy Picture of the Day
Discover the cosmos! Each day a different image or photograph of our fascinating universe is featured, along with a brief explanation written by a professional astronomer.
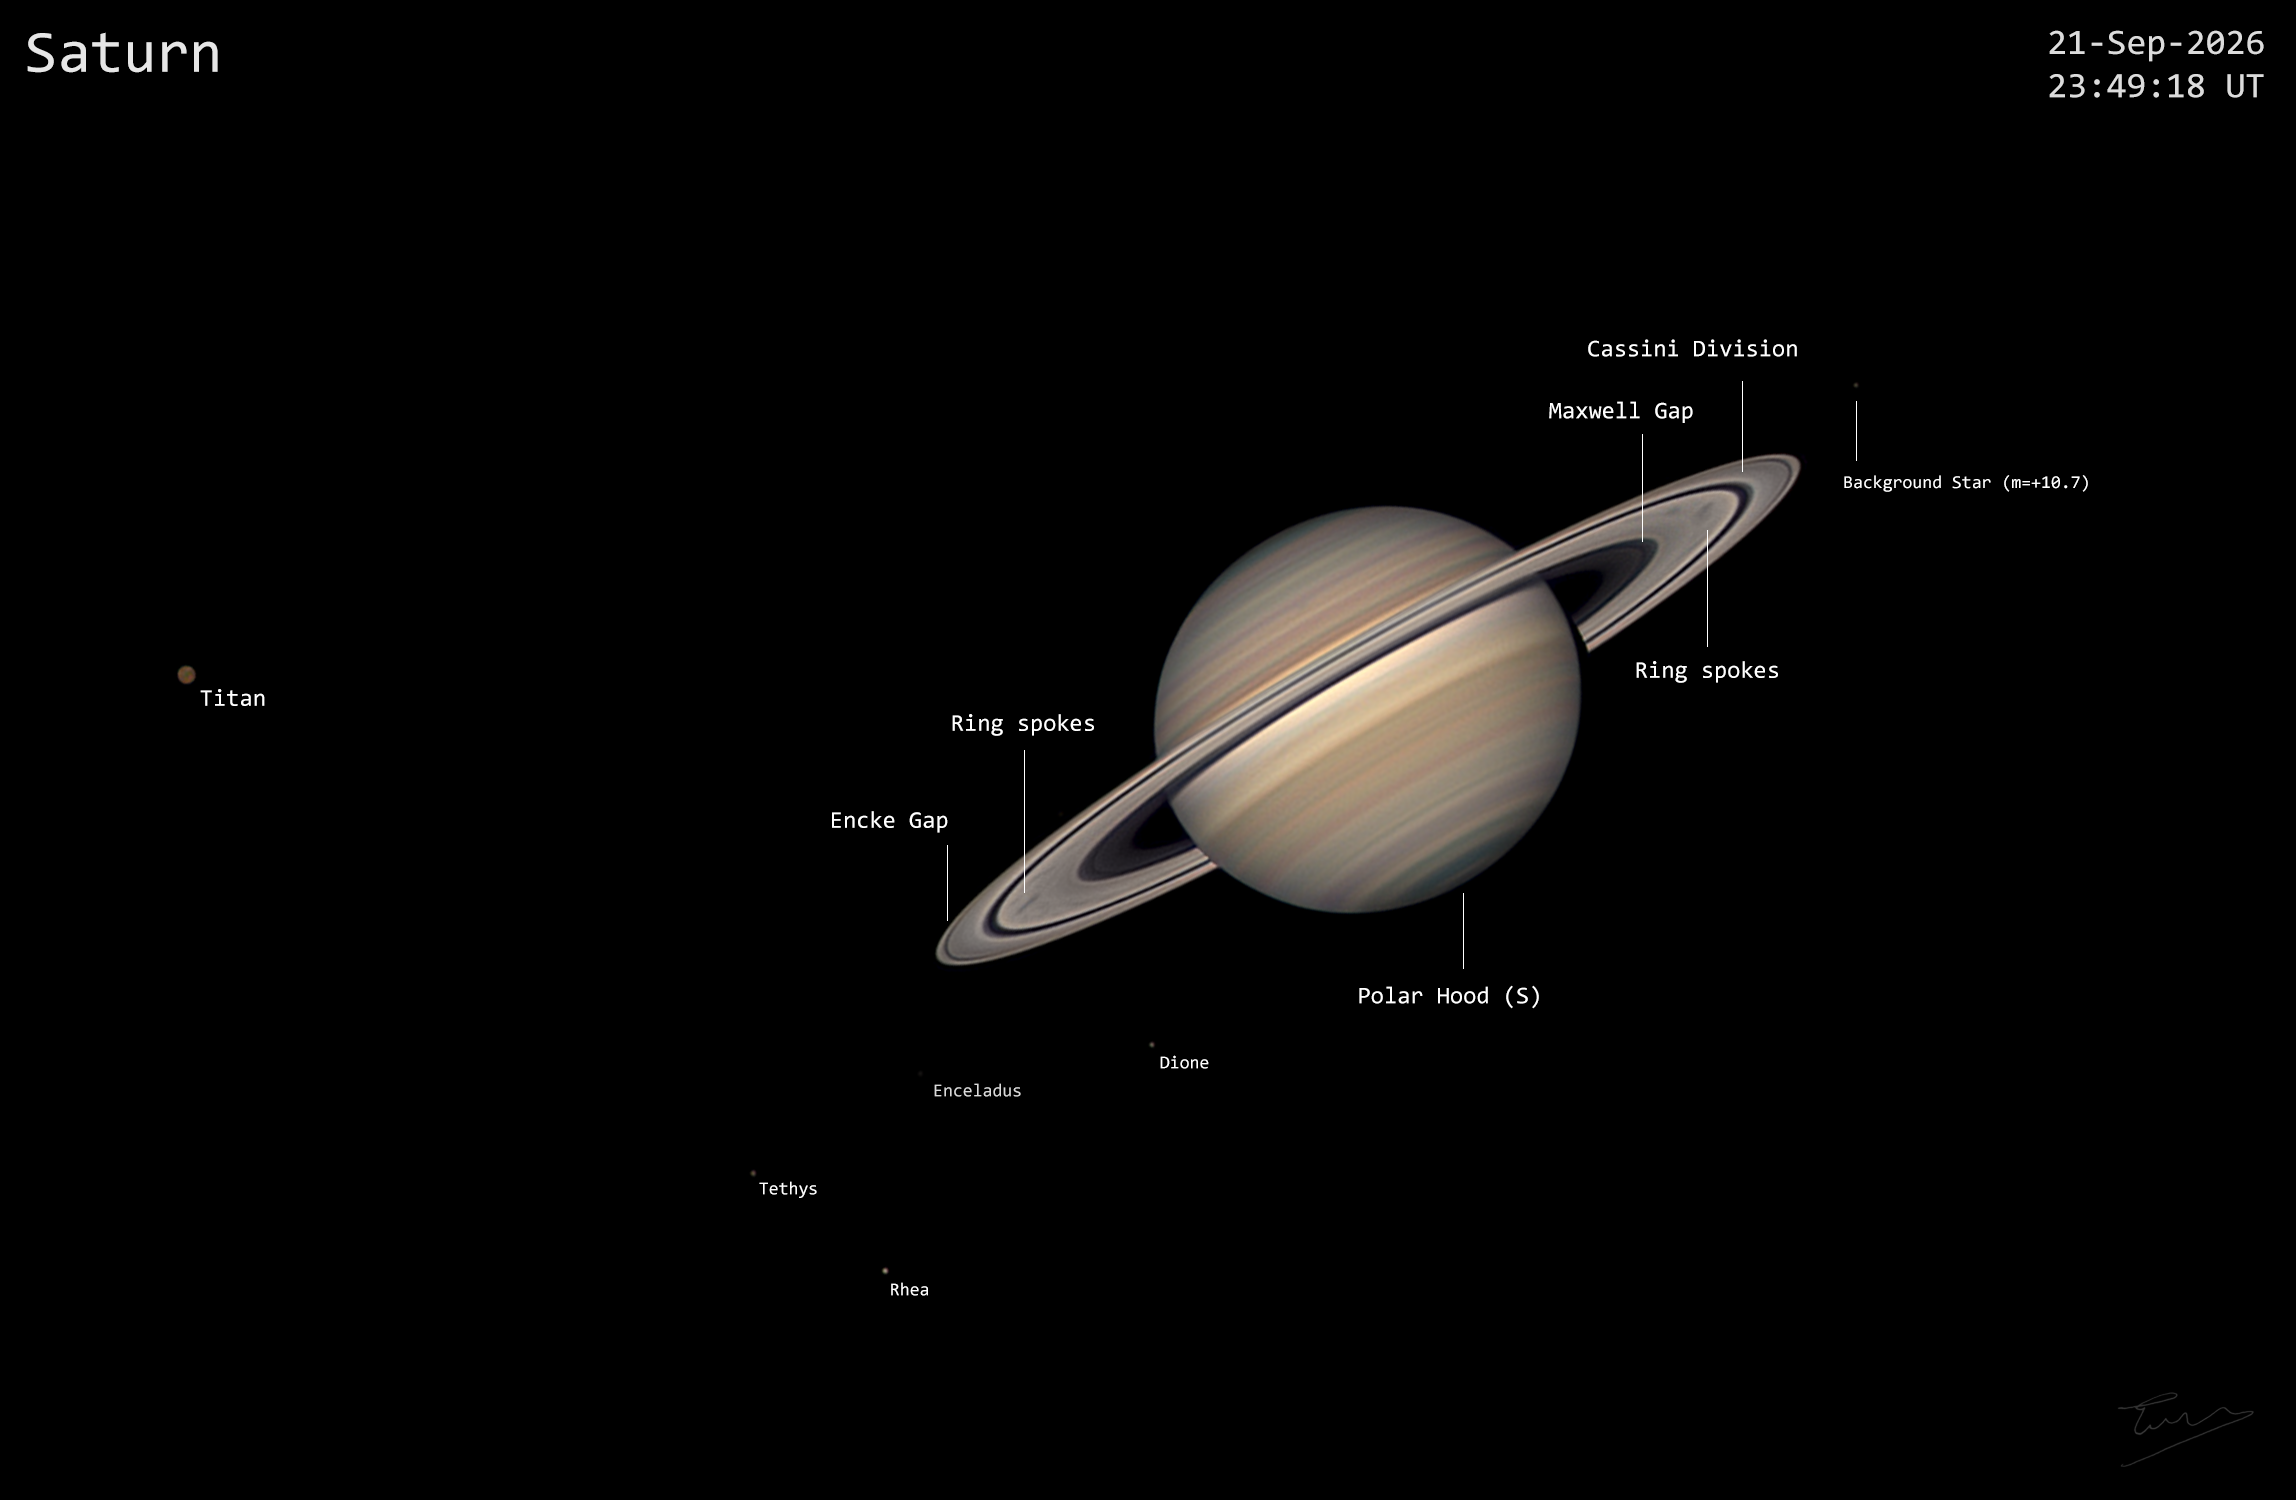
The Saturn System Smörgåsbord
Explanation: How was the Saturn system imaged so clearly? Astrophotographer Tom Williams captured such exquisite details due to one night of exceptional atmospheric conditions above the United Kingdom. This means more than a cloudless sky. Pockets of air at different temperatures and densities move around and bend light as it travels through Earth’s atmosphere, distorting astronomy images. This is called “seeing.” Less atmospheric turbulence means clearer images. The astrophotographer reduced the impact of seeing with the lucky imaging technique: thousands of short-exposure images are taken very quickly with a high-speed camera and the clearest images are added up. Which object in this smörgåsbord interests you? Perhaps Titan or the icy stripes of Enceladus? Maybe the gaps and spokes in Saturn’s rings? Saturn’s opposition, when Earth passes in between the planet and the Sun, occurred on October 4th. Due to the planet’s proximity and full illumination from the Sun, now is a great time of year to observe it!
Tomorrow’s picture: bumpy
| Date: | October 8, 2026 |
|---|---|
| Credit: | Tom Williams |
| Authors & editors: | Keighley Rockcliffe, Robert Nemiroff, Jerry Bonnell, Cecilia Chirenti |
| A service of: |
ASD at NASA / GSFC, NASA Science Activation & Michigan Tech. U. |
Fighting Drought in Texas Cotton Country
2026-10-08 04:01
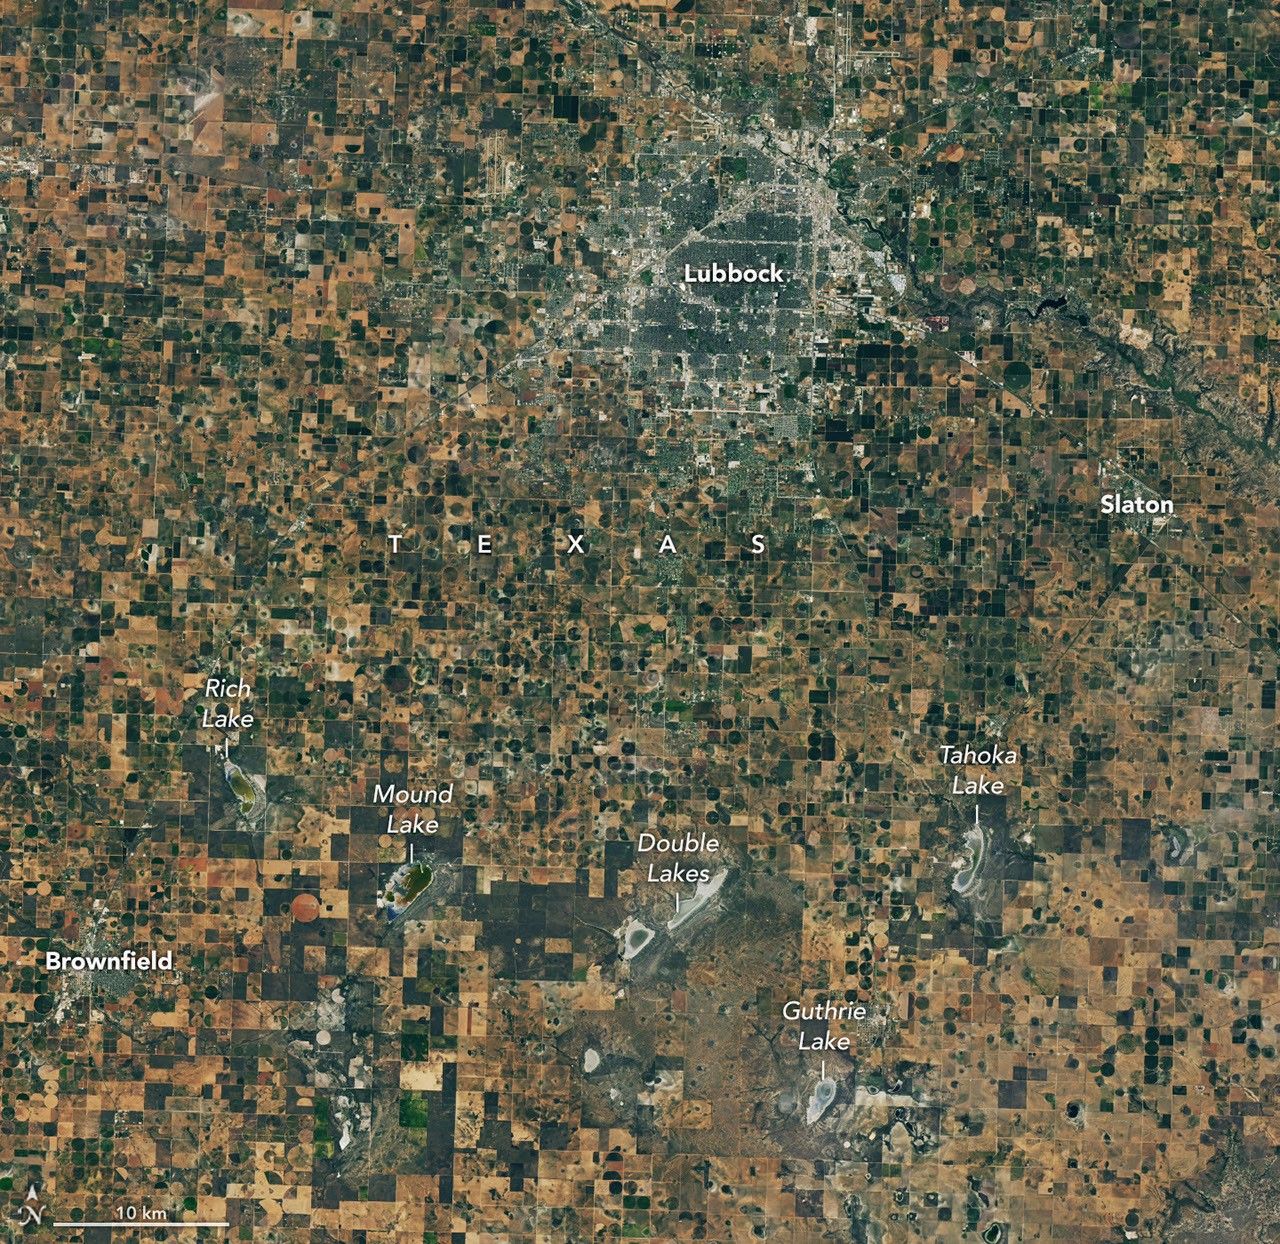
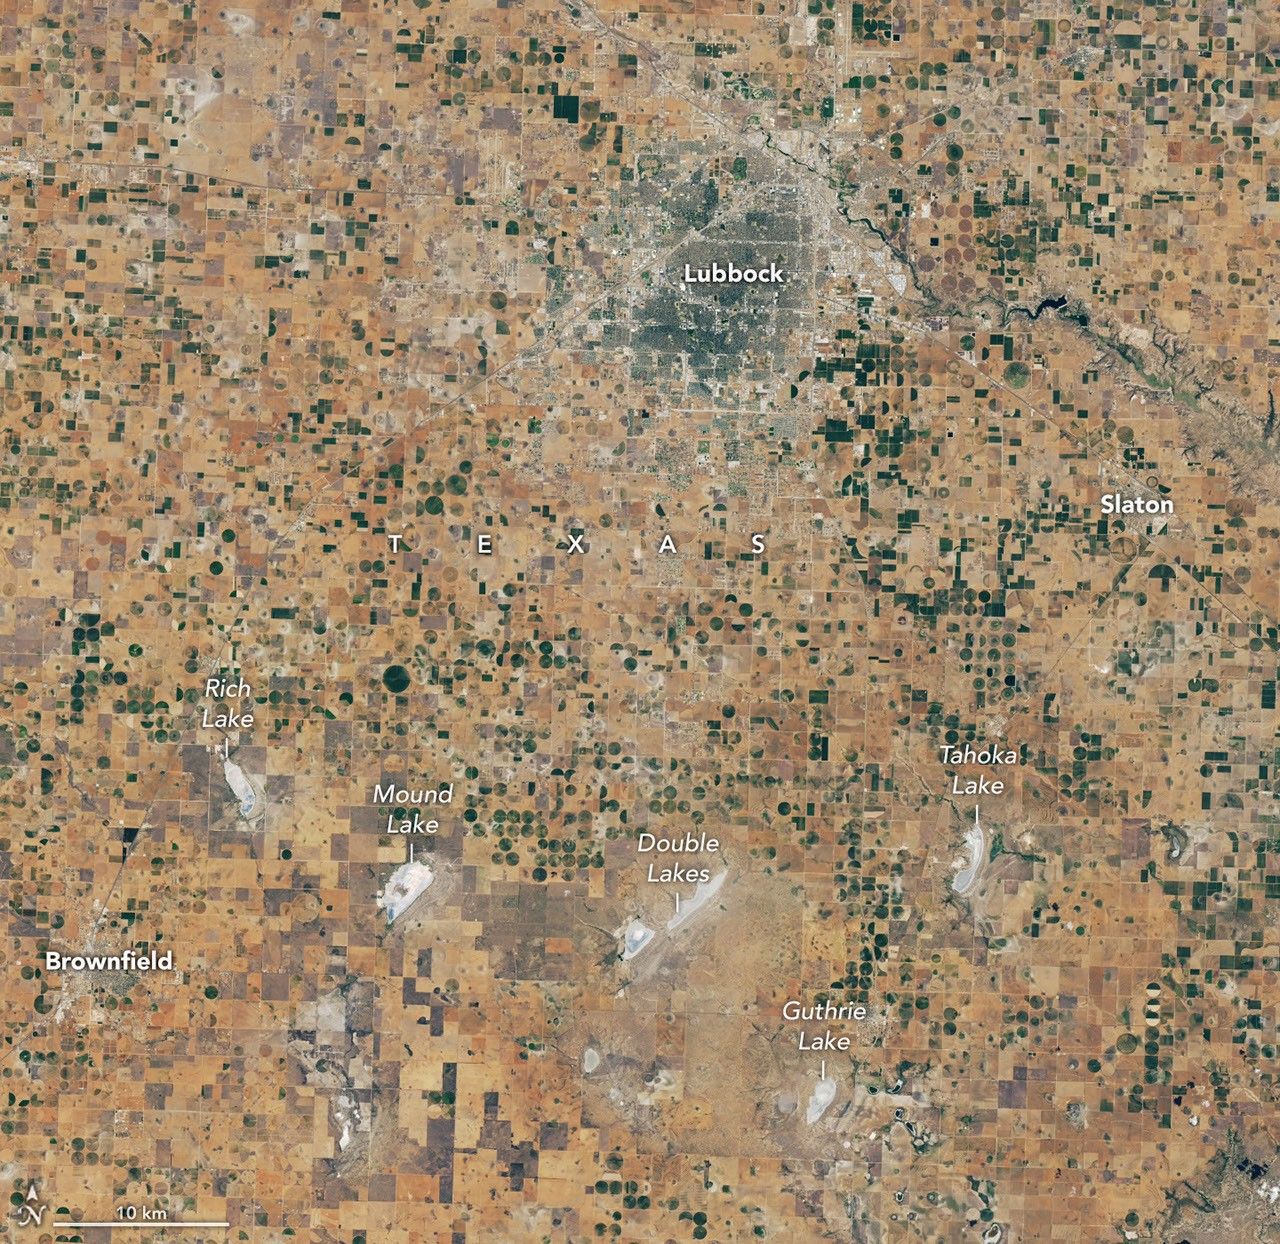
September 22, 2025
September 9, 2026
For many longtime cotton farmers in the Texas High Plains, the 2026 drought sparked flashbacks to catastrophic harvests of the past. Miserably dry seasons forced farmers in America’s largest cotton-producing region to abandon massive portions of their dryland crop, including 72 percent in 2022 and 66 percent in 2011.
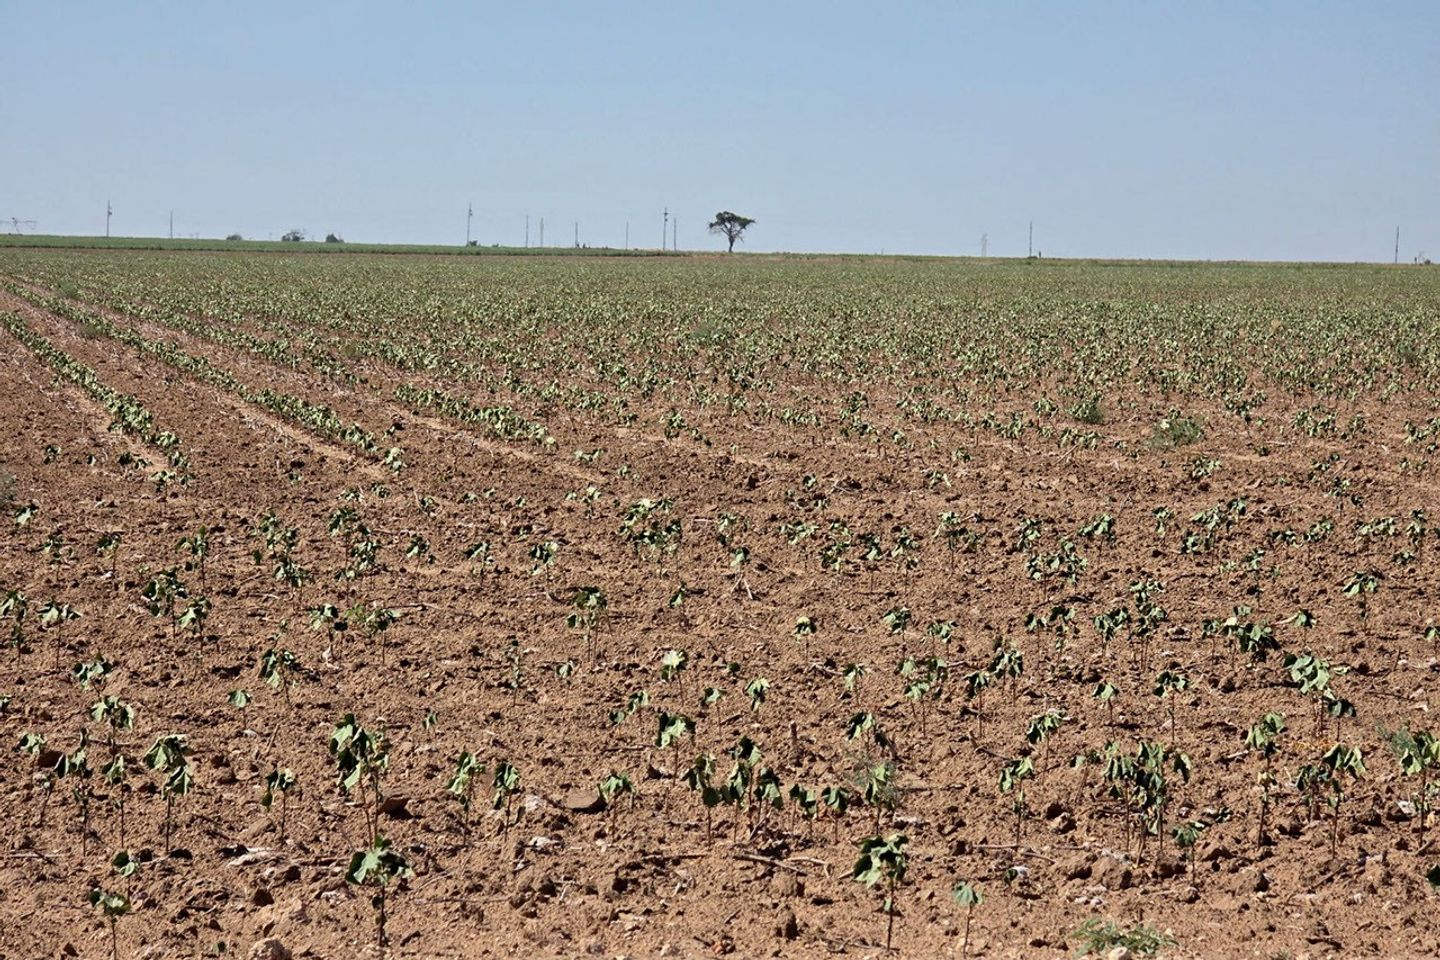
But in some ways, farmers felt the drought in 2026 entered new territory. “This is the first year that we’ve had cotton completely die,” said Lacy Cotter-Vardeman, a farmer based in Lubbock County whose family has worked the land there for several generations. “I was just talking to our insurance people, and they said they’d never seen this before,” she said, adding that roughly 90 percent of her dryland cotton was dead.
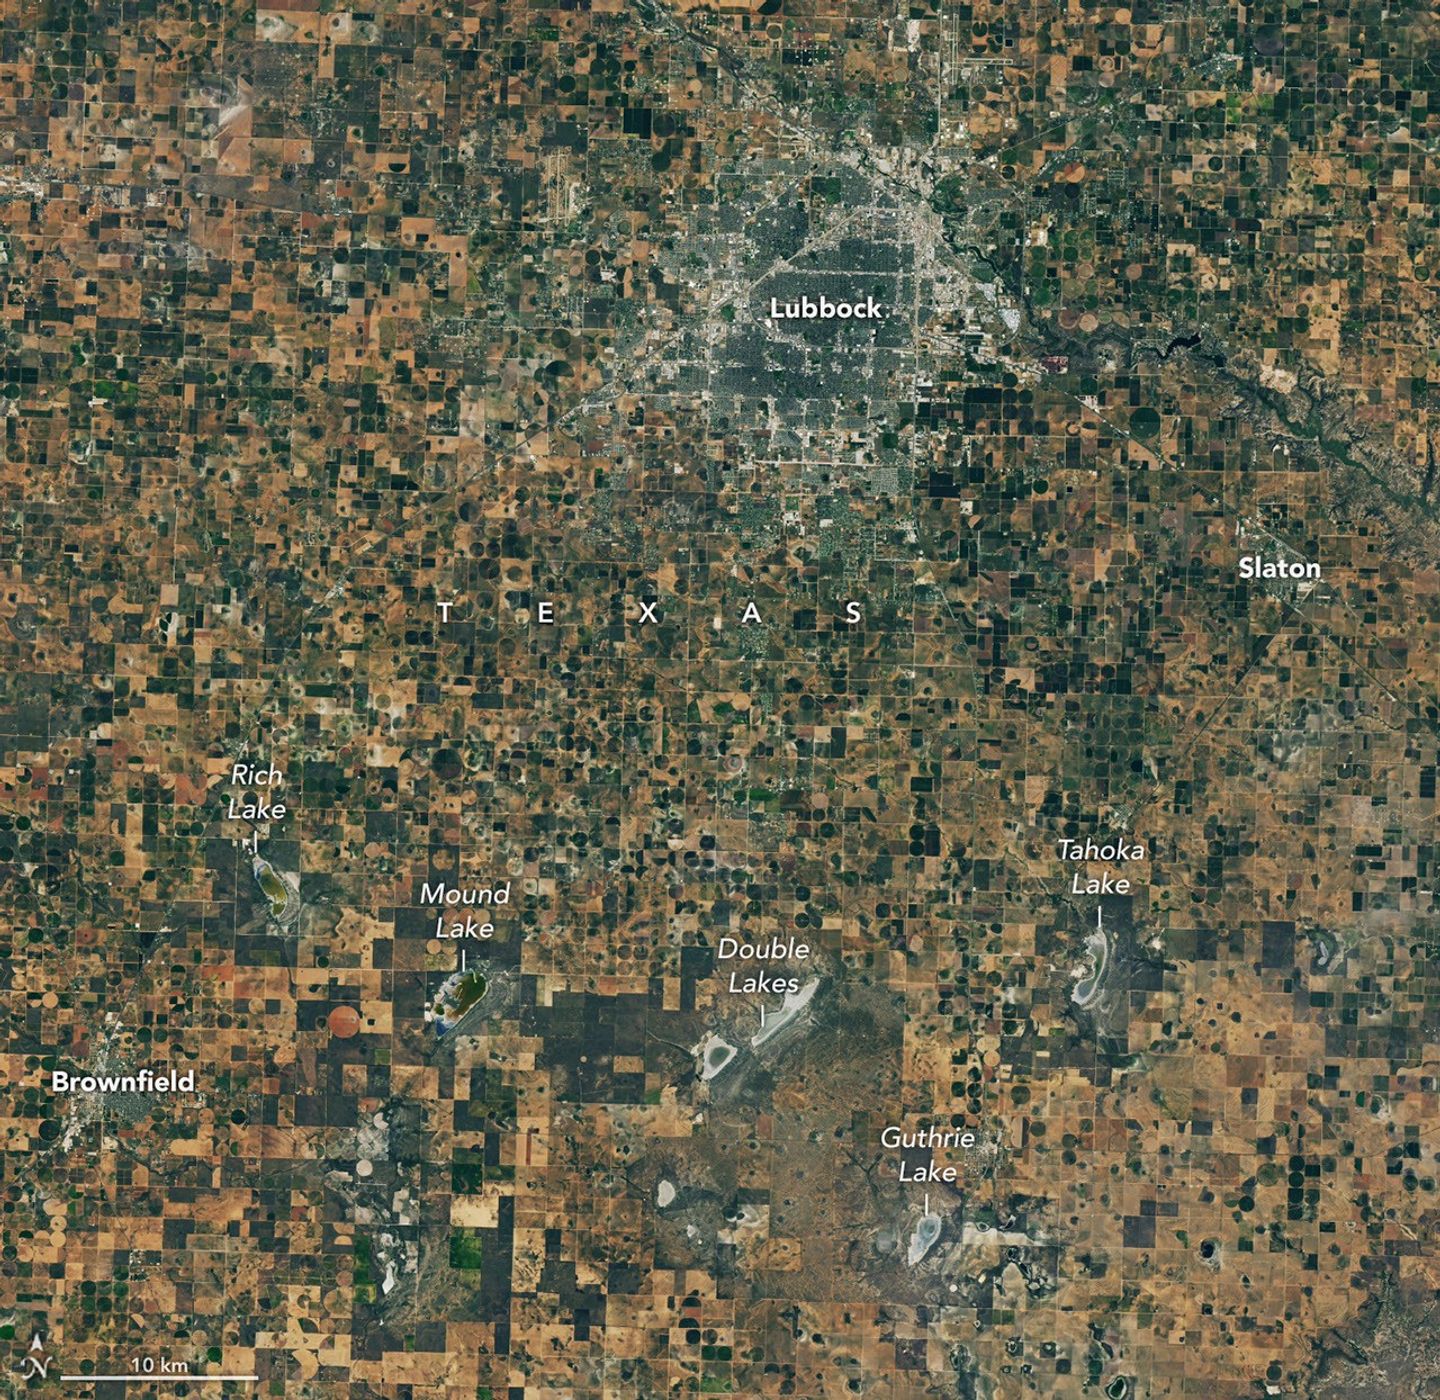
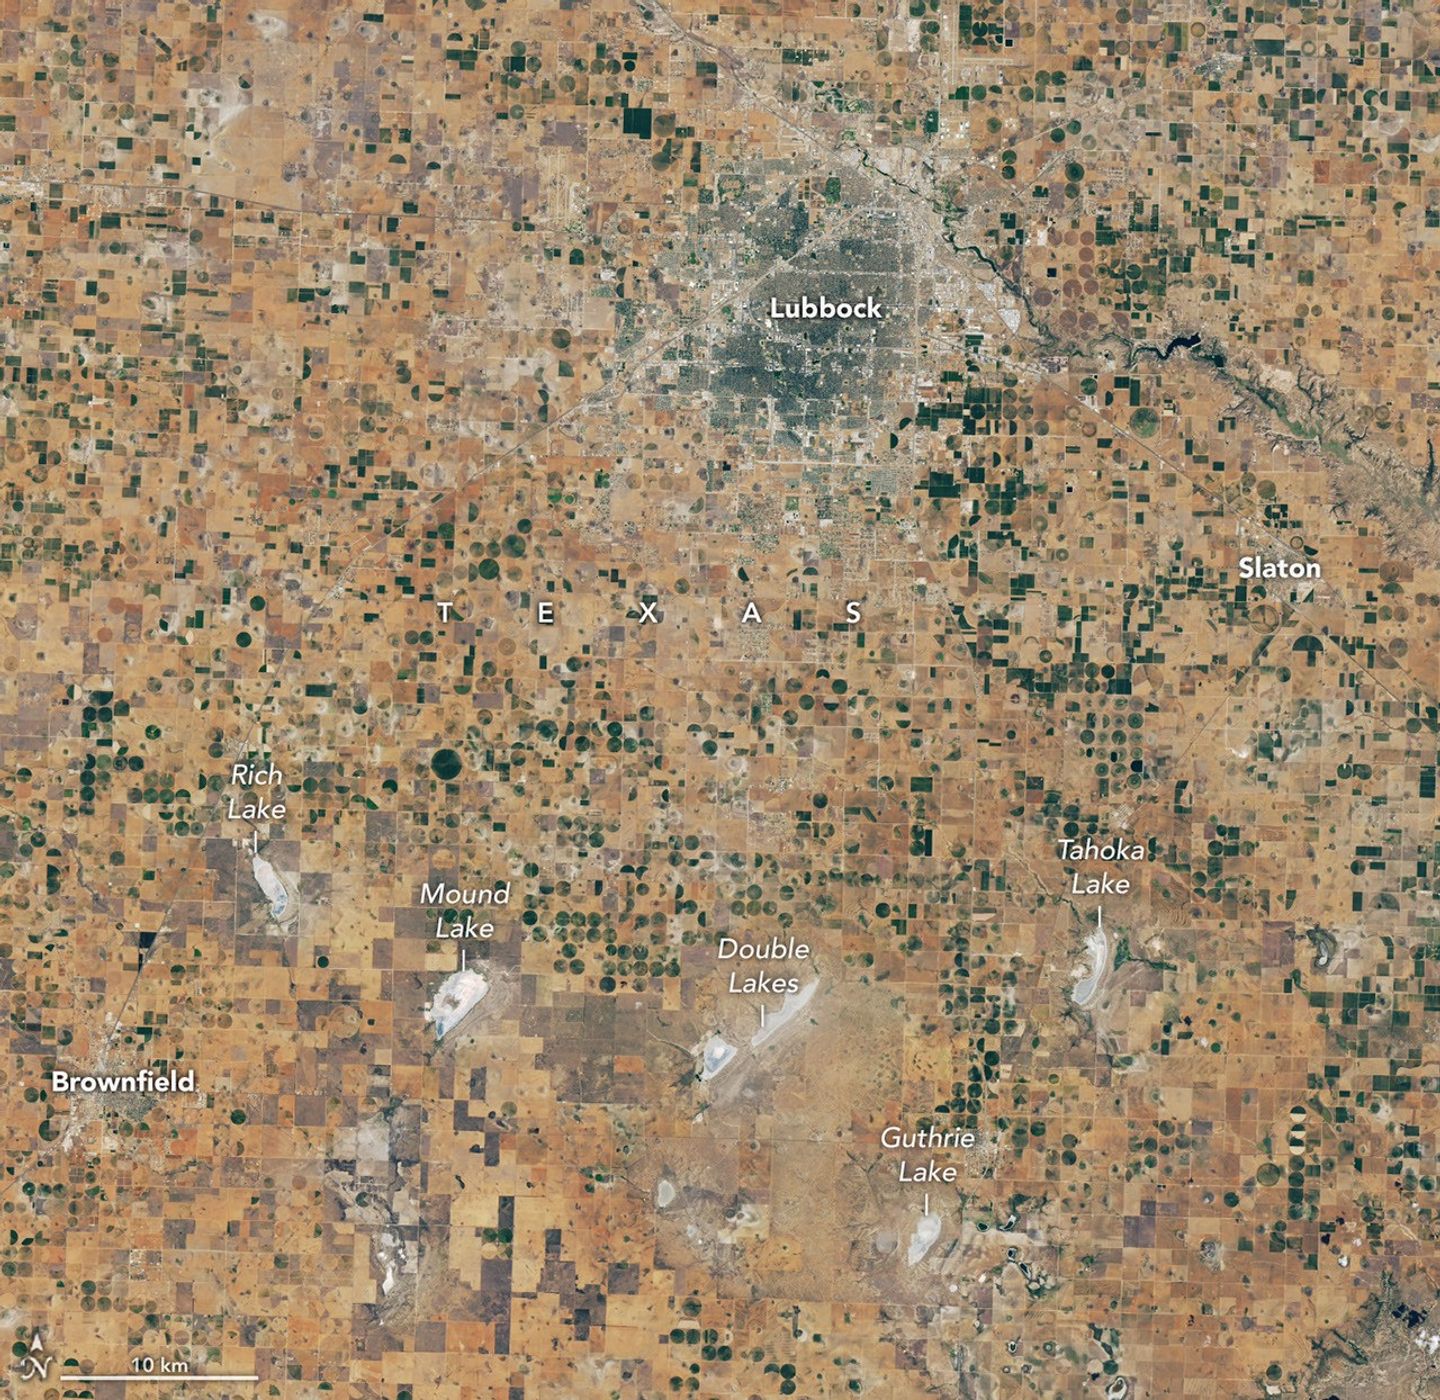
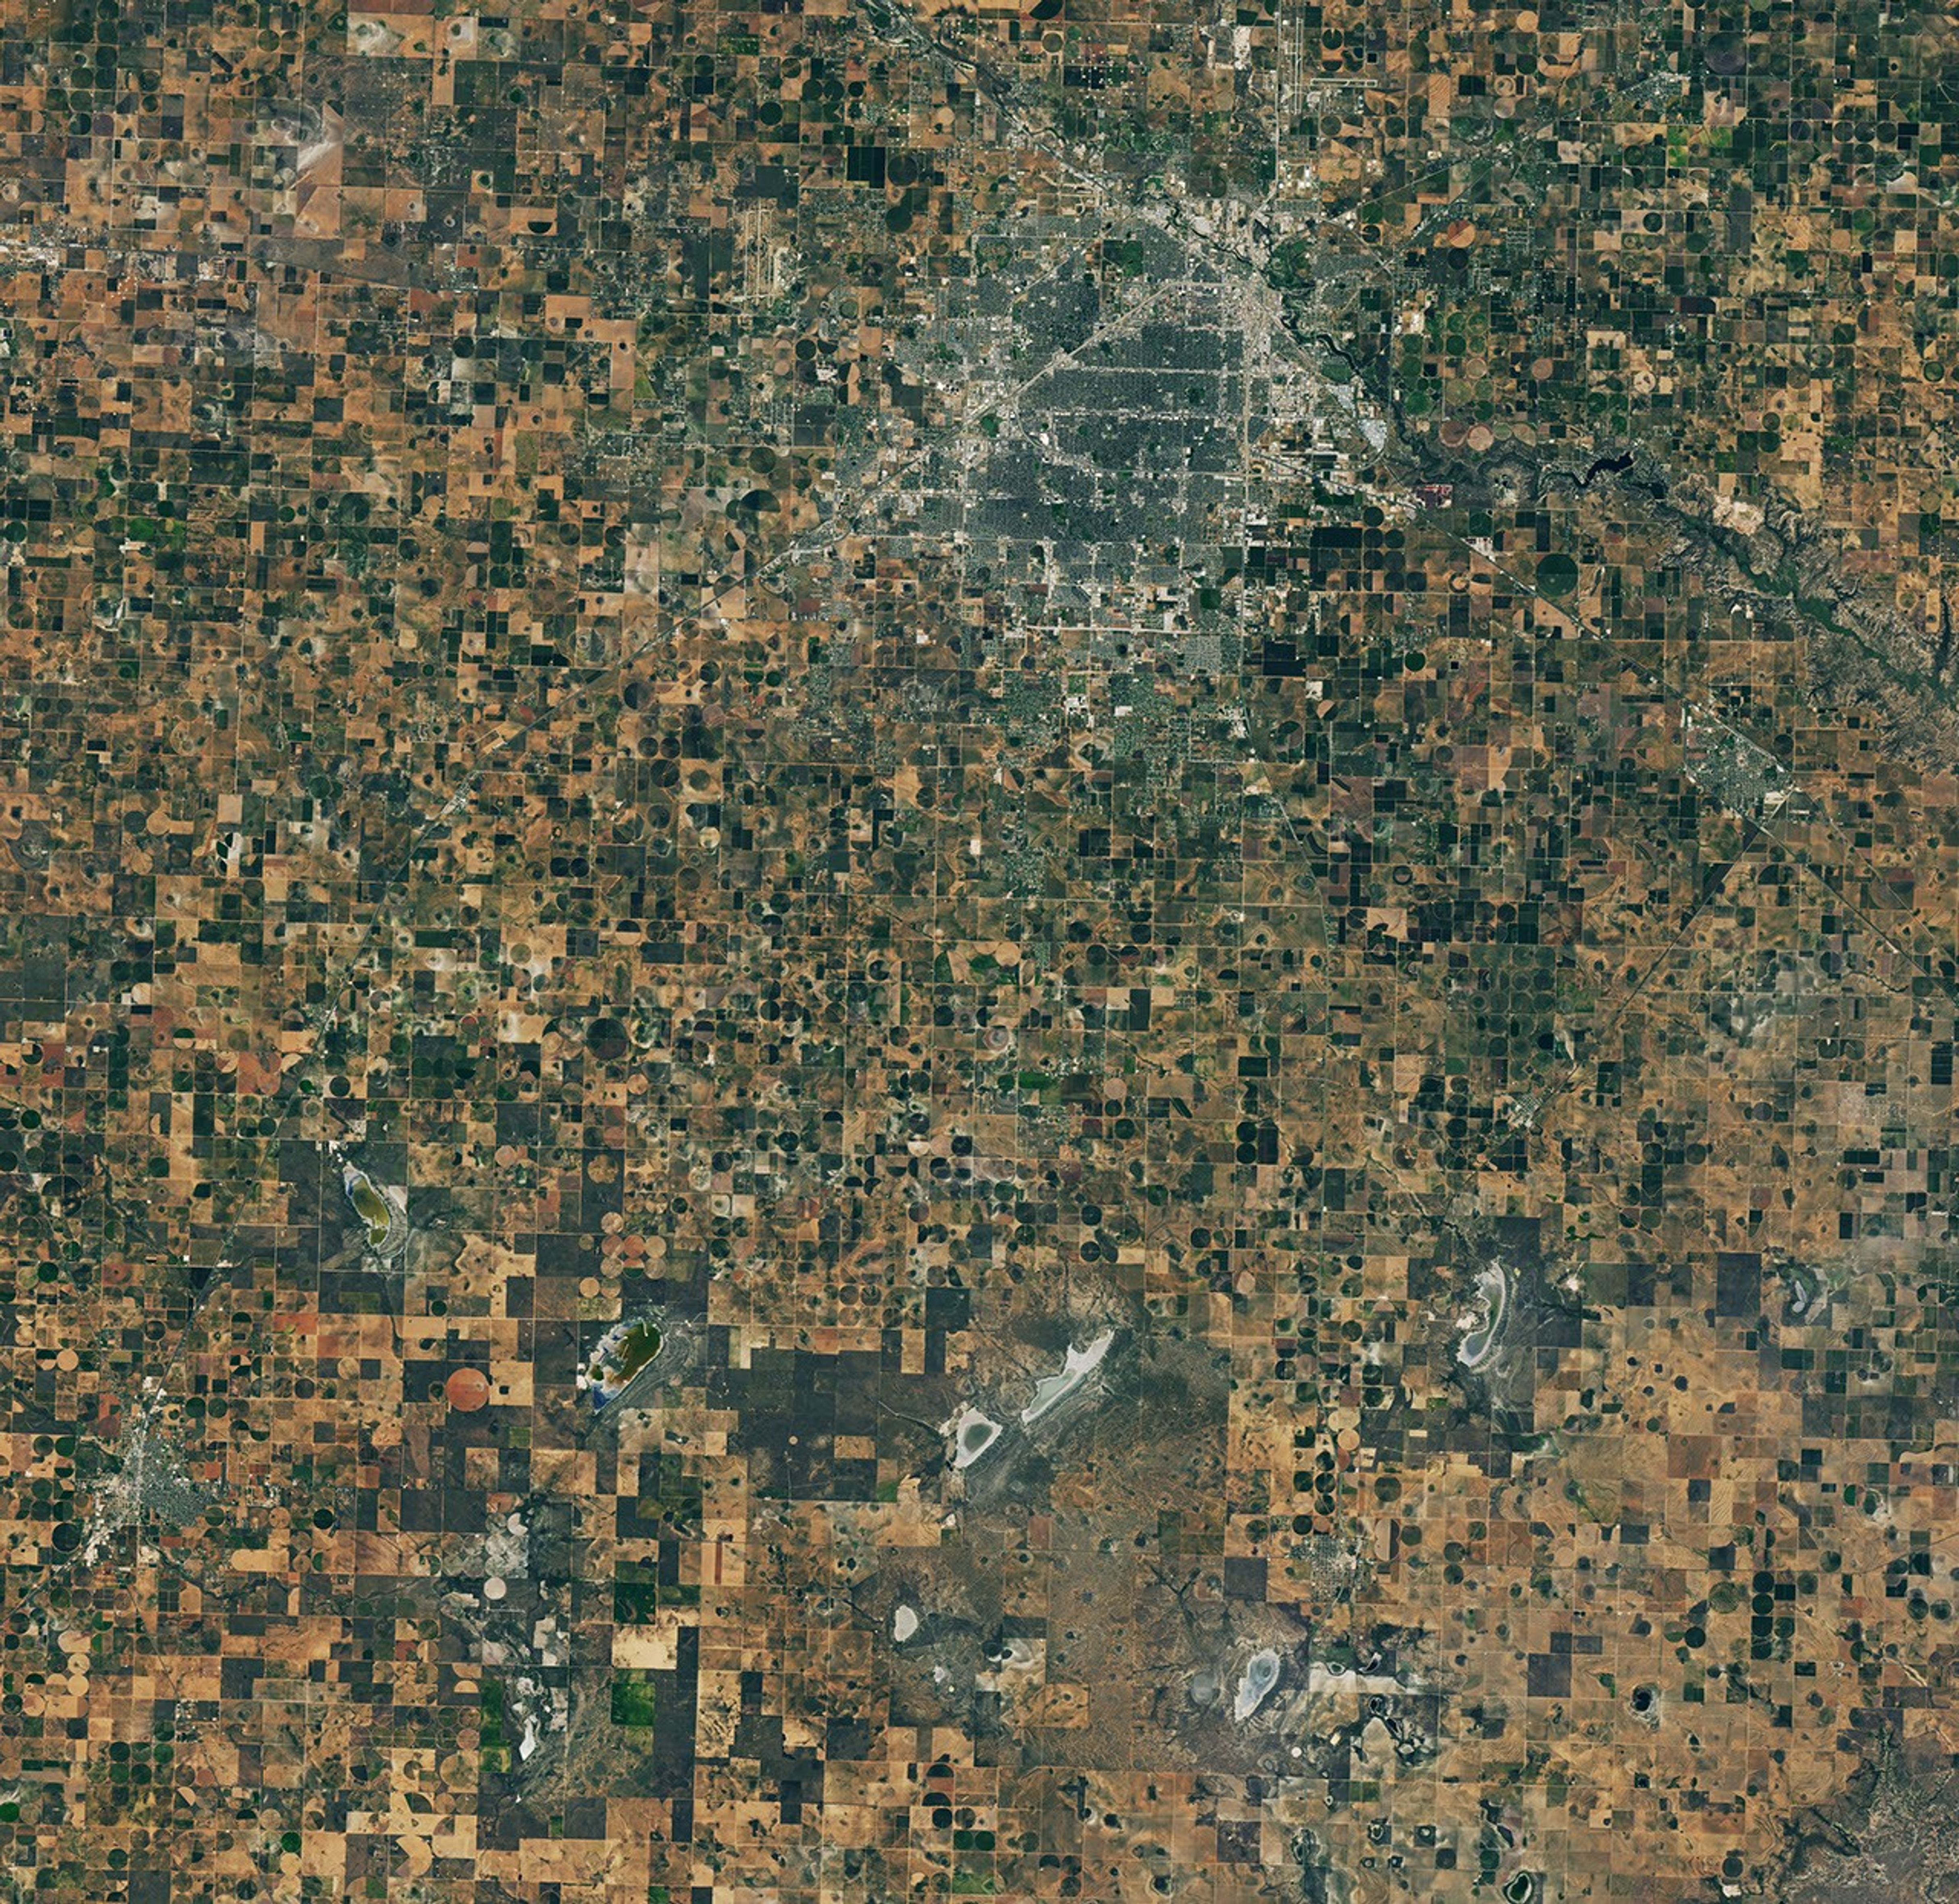
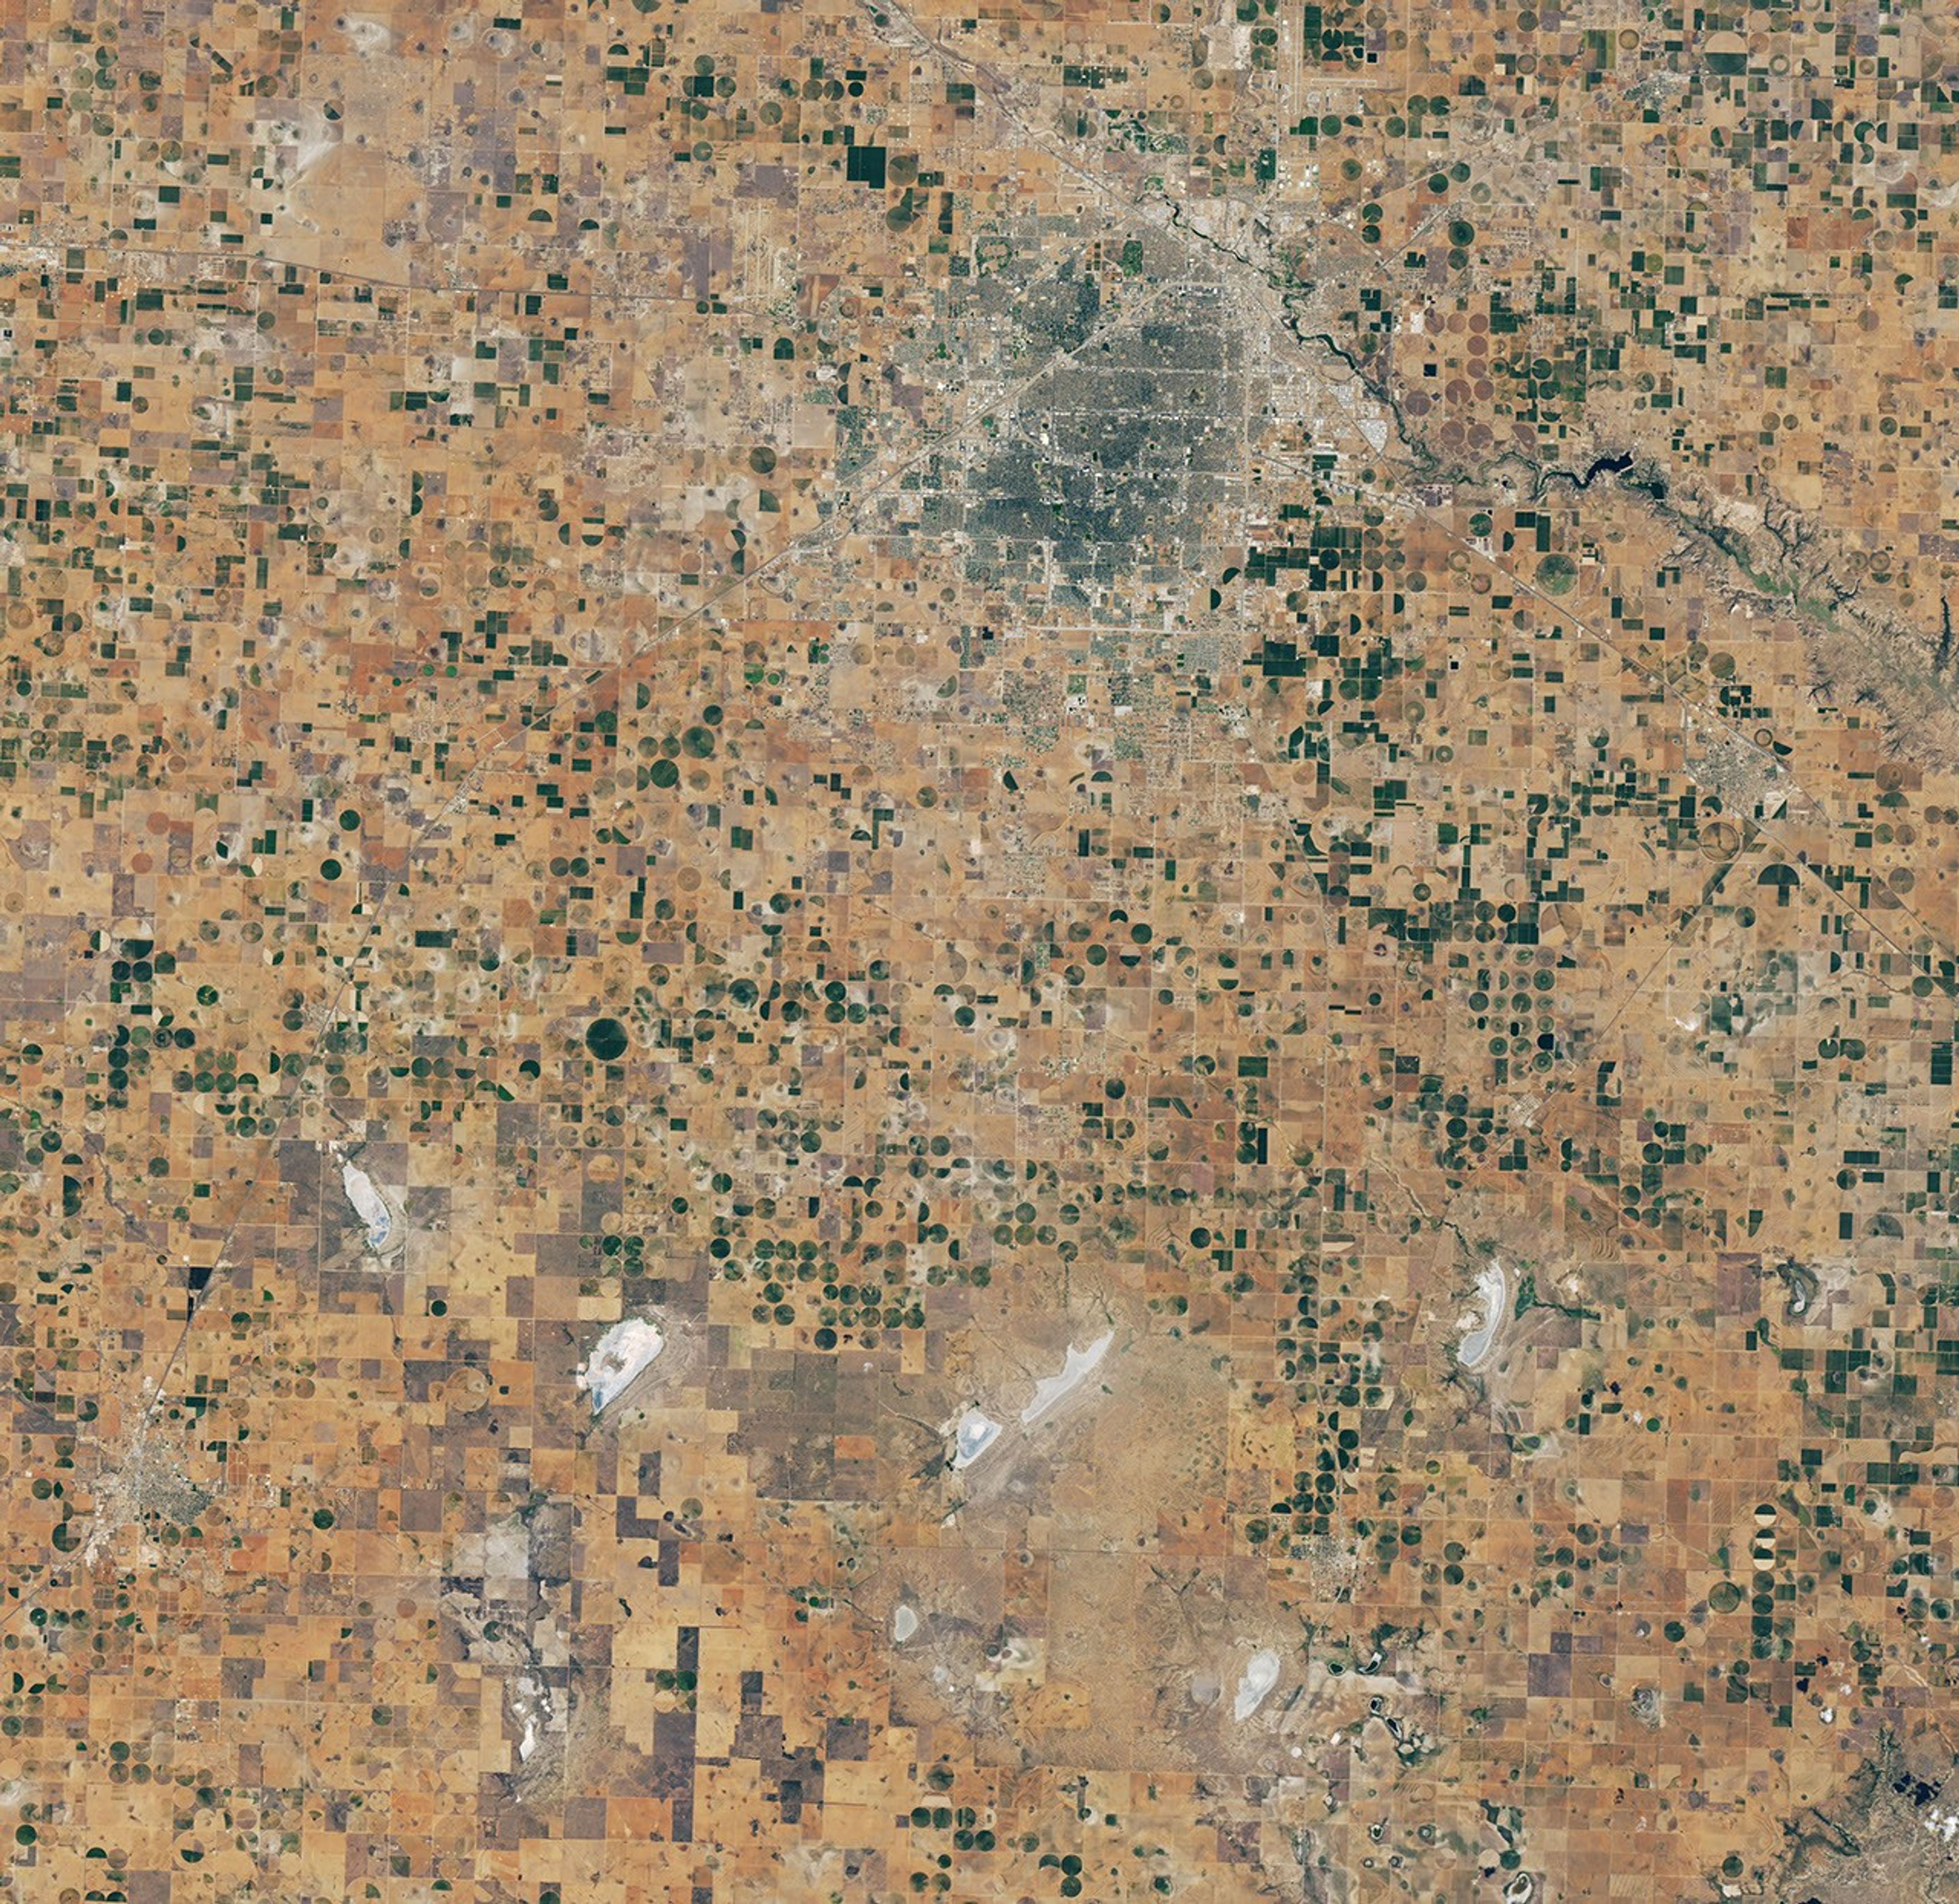
Satellite images highlight the scale of the problem in Lubbock and adjacent counties. Brown, parched crops and vacant plots dominated the landscape on September 9, 2026, when the OLI (Operational Land Imager) on Landsat 8 captured the image above (right). In contrast, much greener landscapes prevailed on September 22, 2025 (left), when the sensor captured an image of the same area during a more typical year with a relatively healthy harvest.
Subtler signs of the drought are also visible. With groundwater growing scarce in the High Plains aquifer, many farmers in the region have started irrigating just one-half or one-third of their center-pivot fields, explained Tillery Timmons-Sims, an agricultural conservationist who owns land in Brownfield, Texas, and used to grow cotton. In the imagery, these appear as green semicircles and quarter circles.
Note also the many shallow water features known as playa lakes—sometimes called mud holes, buffalo wallows, and lagoons—scattered throughout the image. Some, like Double Lakes and Mound Lake, are fairly large, but most of the more than 19,300 playa lakes in the Texas High Plains are quite small, less than 30 acres.
Many of these ephemeral lakes were dry in September 2026, unlike the previous year. Playa lakes are critical in this water-stressed region because the clay-lined features, if active, collect rainfall and provide pathways for water to seep underground and recharge the aquifer below, the region’s primary source of irrigation water. However, some 80 percent are so modified by tilling or buried with sediment that they no longer function that way.
Farmers in this region operate along the eastern margin of the aquifer, which has declined sharply in recent decades. According to U.S. Geological Survey data, the water table across much of Lubbock County has dropped by between 25 and 100 feet since 1950, around when people began drawing large volumes of water from the aquifer to irrigate. Losses have been even more extreme (150 feet or more) in counties to the north, including Parmer, Castro, Swisher, and Briscoe.
The aquifer’s long-term decline, combined with the 2026 drought, left many wells “pumping air” this summer for some of the farmers Timmons-Sims knows. “We simply don’t have groundwater to fall back on anymore,” she said. Many farmers she knows thought that water might run out during the next generation; instead, it’s “happening now,” she said. For Cotter-Vardeman, the problem couldn’t be more tangible. Many of her irrigation wells stopped working in August.
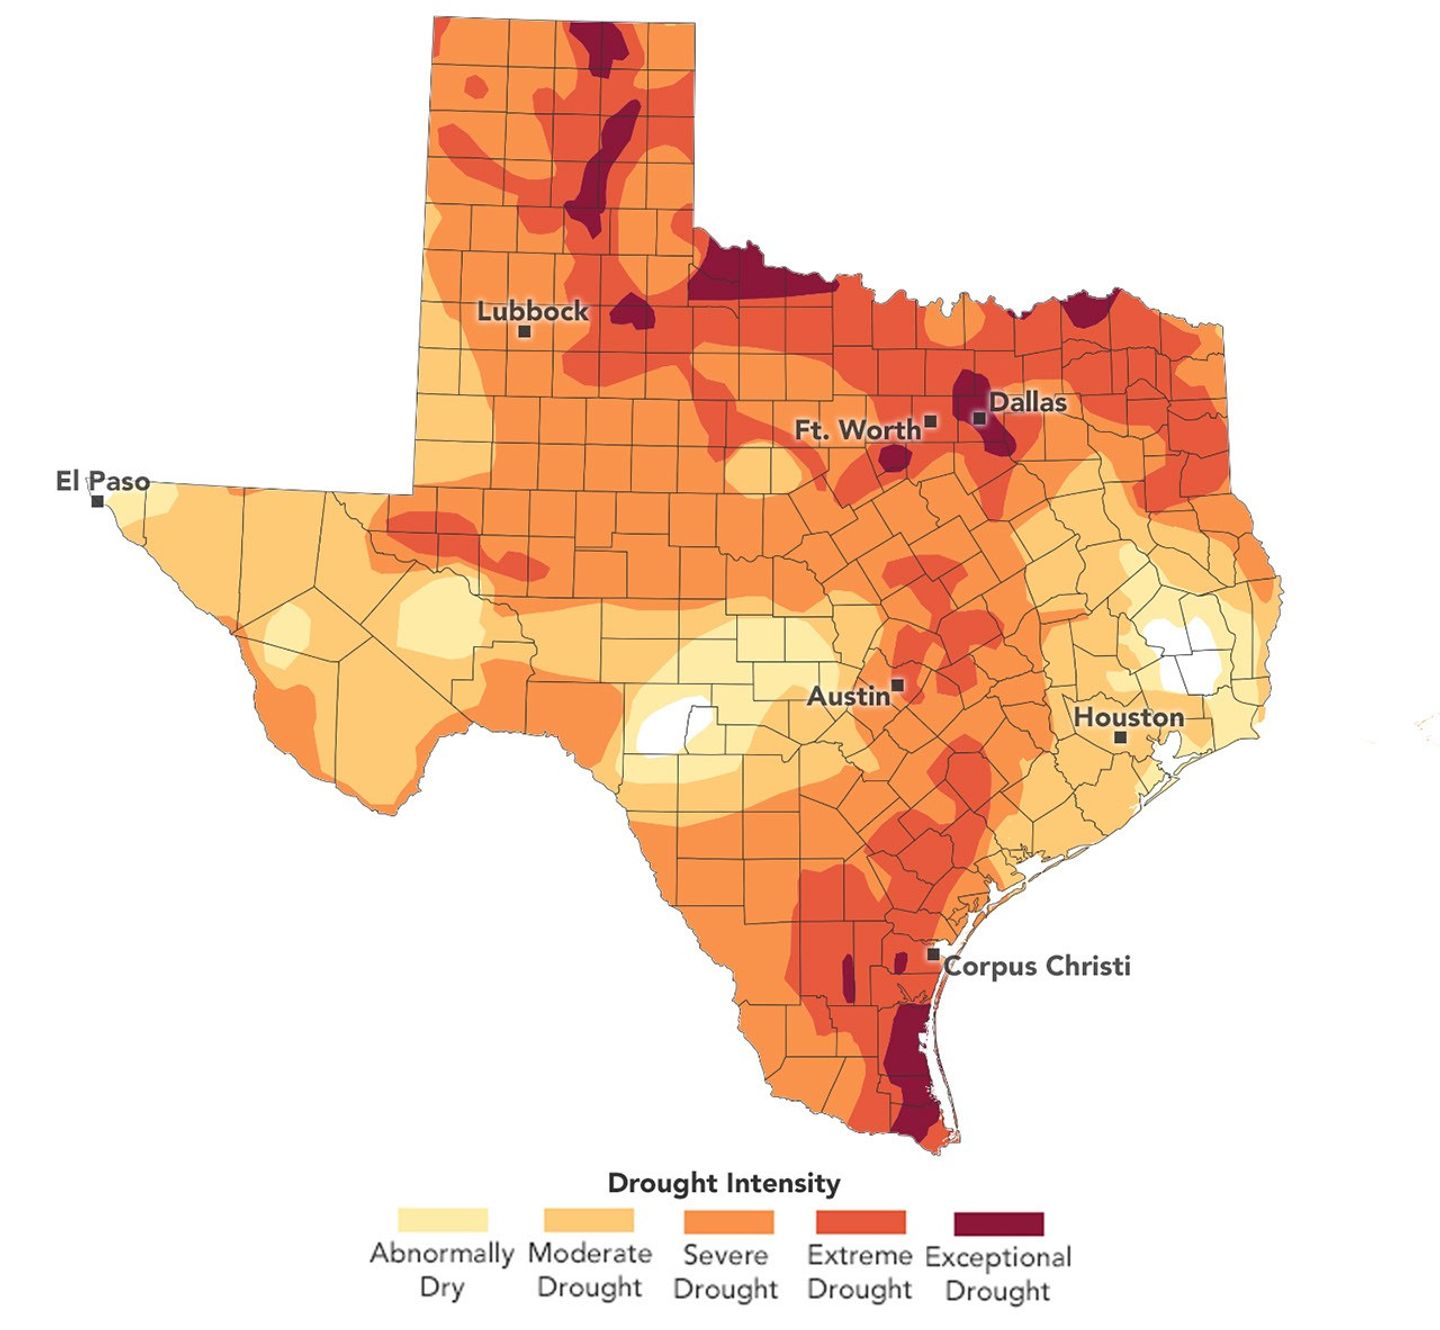
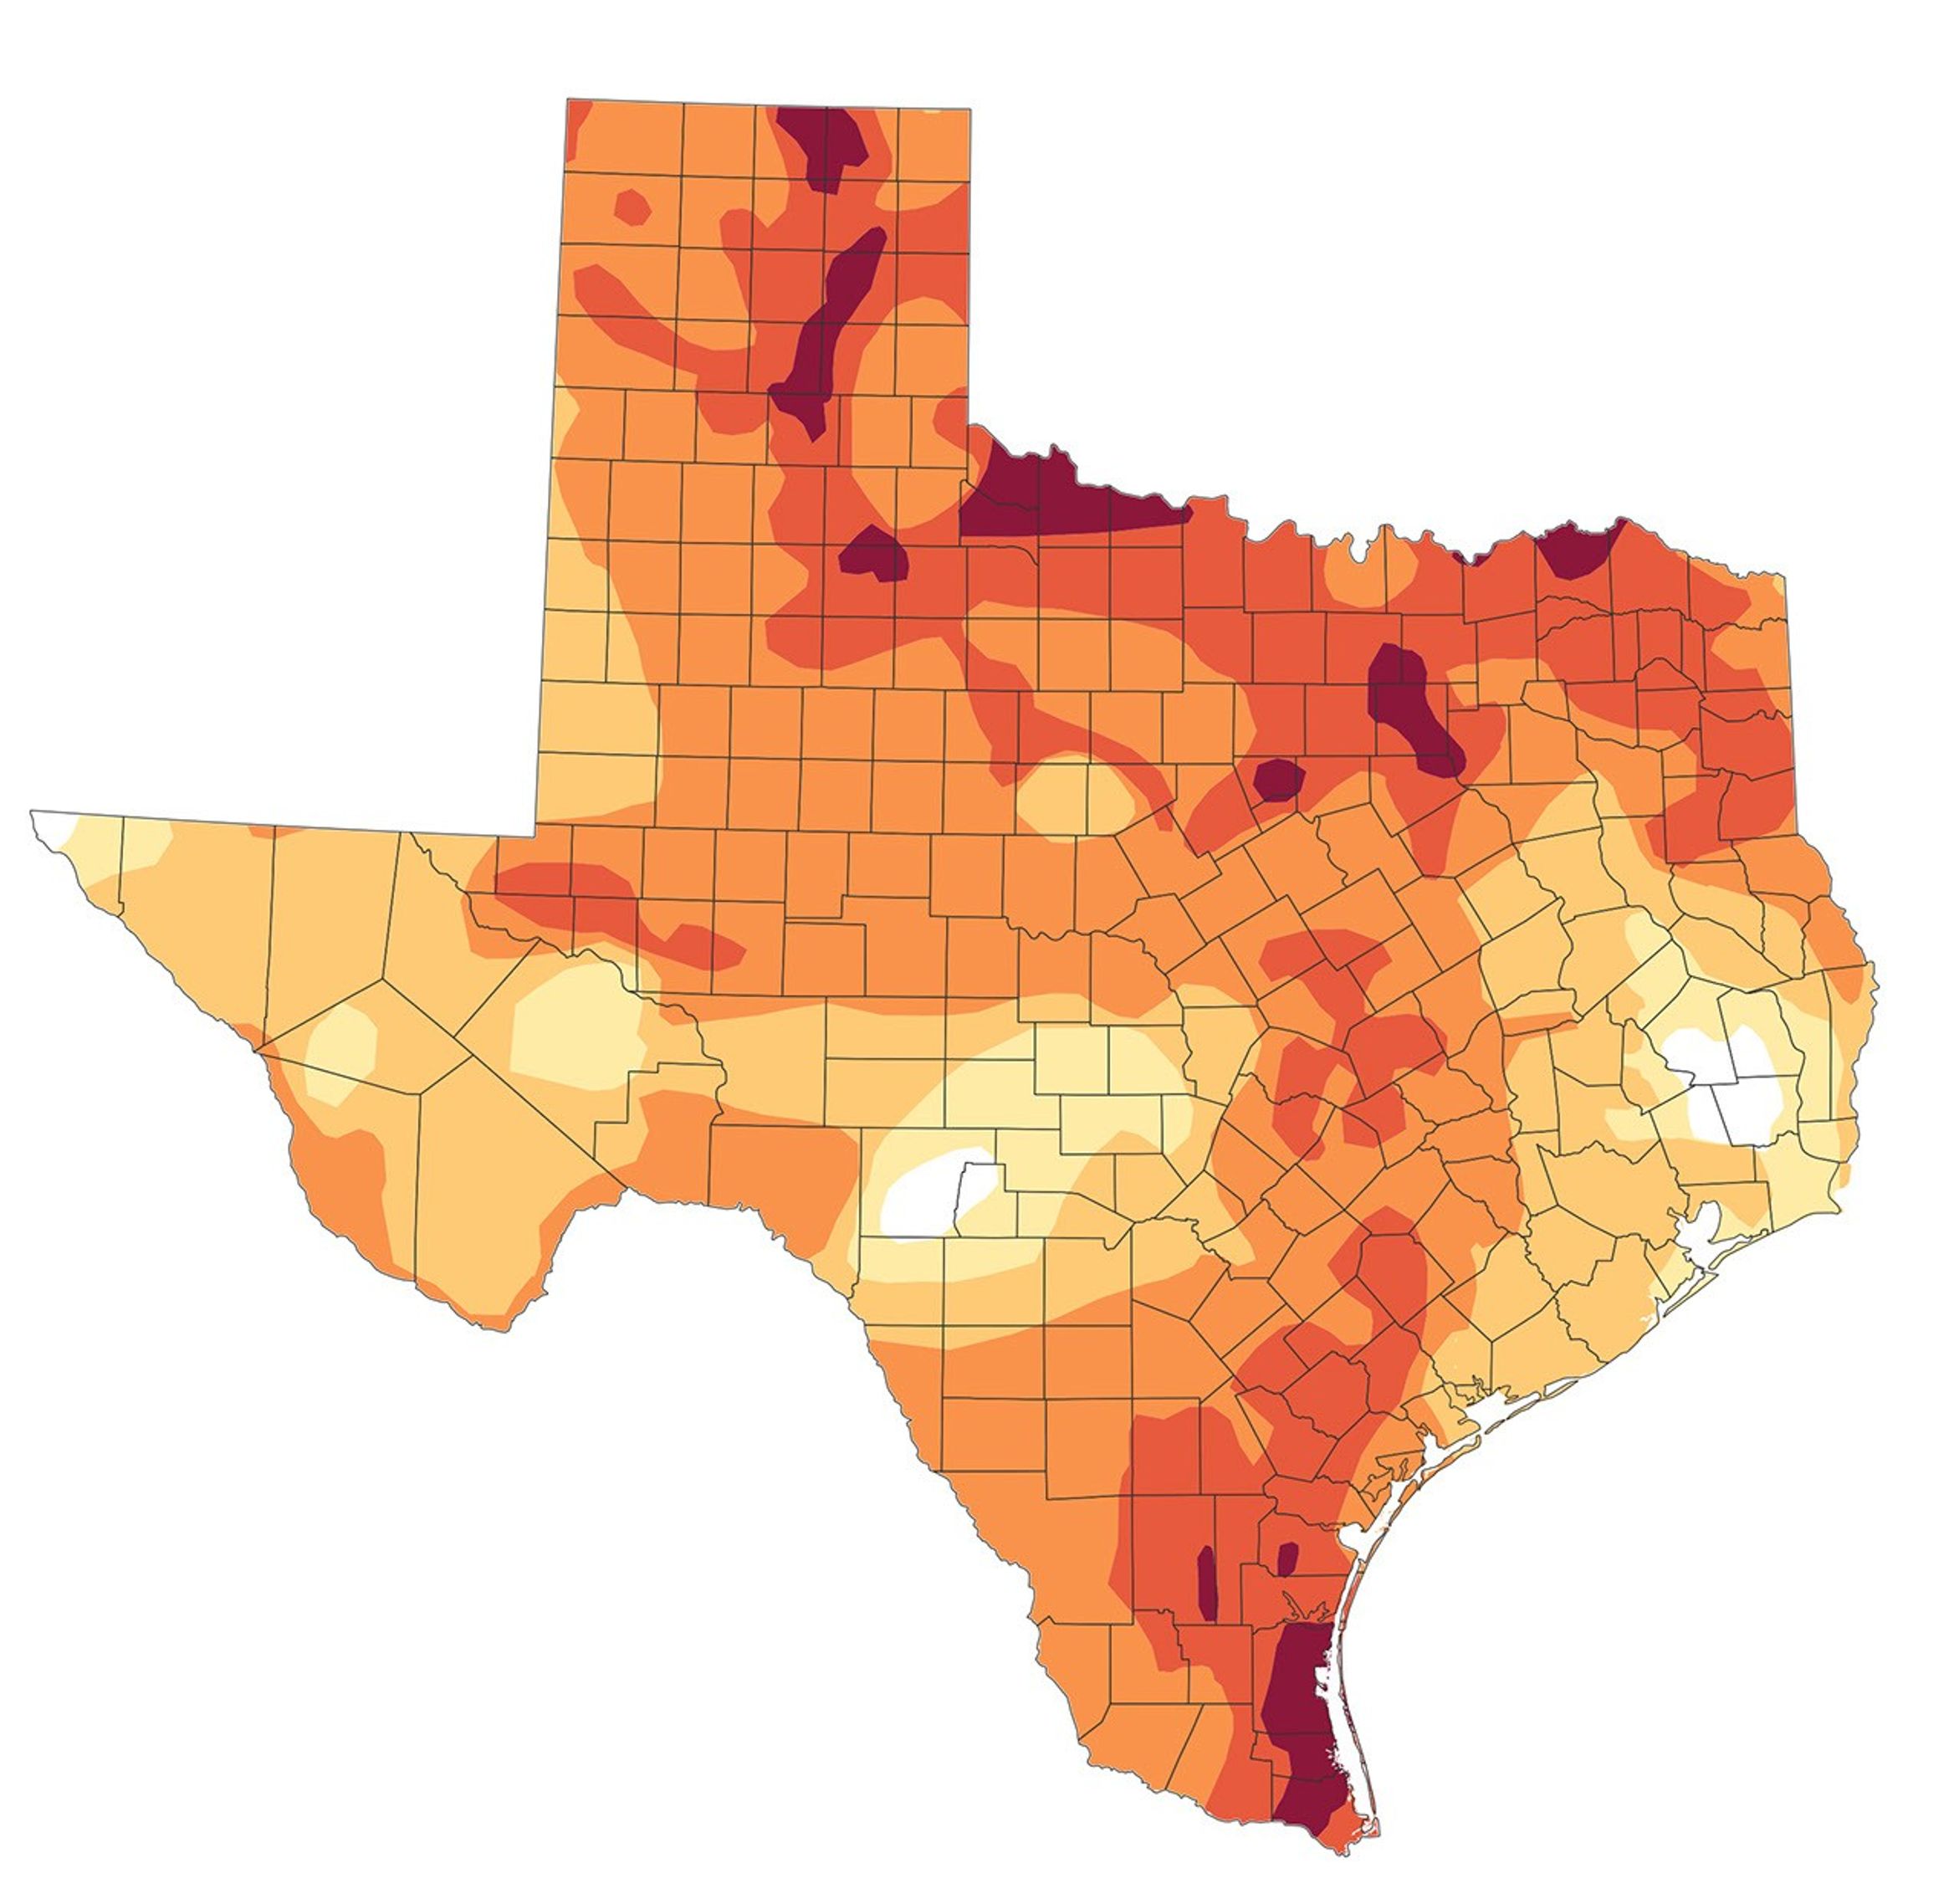
Rains in September and October, aided by a strong El Niño in the Pacific, are bringing needed moisture to the region, but they haven’t been enough, according to analysis from the U.S. Drought Monitor. “It will take about 7 inches of rain over a three-month period to ‘end’ the current drought,” said Jonathan Case, a meteorologist at NASA’s Marshall Space Flight Center and one of the Drought Monitor’s authors.
The deteriorating aquifer is one of the reasons Timmons-Sims stopped farming in 2007. She now spends most of her time searching for ways to keep farms in business, such as converting irrigated croplands to grasslands to earn water credits, developing alternative energy projects, adopting water-efficient techniques, and working with conservation organizations to plan for the long term.
Through that work, the Sandhills Area Research Association, a conservation organization she helps run, partnered with NASA Acres, a research consortium that connects farmers with NASA science to address agricultural challenges.
In August, a NASA Acres listening tour brought NASA officials to Cotter-Vardeman’s farm in Slaton, a vineyard in Meadow, and parched cotton fields in Kress (below). At each stop, the conversation returned to water: how to preserve the ailing aquifer, and how farmers could manage their land in ways that would help restore playa lakes and return billions of gallons of water to the aquifer.

The playa lakes around Lubbock were among the first scientific topics researchers studied after Landsat 1 launched in 1972. One early analysis by a Texas Tech geoscientist highlighted the Double Lakes playa (shown above), estimating that monitoring lakes from space would cost just a fraction of what ground surveys would.
More recently, a team of Texas Tech University researchers used a deep learning framework to identify and track changes affecting thousands of playa lakes over three decades. Their results, published in September 2026, showed that since 1995, playa lakes declined significantly in 15 of the 45 counties analyzed, highlighting the water challenges facing farmers like Cotter-Vardeman, a member of NASA Harvest’s Farm Innovation Ambassador Team (FIAT).
In Texas, Timmons-Sims and the FIAT team are working to connect farmers and NASA scientists, making it easier for farmers to use NASA data to decide what and when to plant, how to use cover crops and irrigation, and how to manage sediment and playa lakes. “We’re simply running out of time and water,” Timmons-Sims said. “Farmers need information, innovation, optimization, and solutions—and they need it now.”
NASA Earth Observatory images by Lauren Dauphin, using Landsat data from the U.S. Geological Survey and the U.S. Drought Monitor at the University of Nebraska-Lincoln. Photos by Lacy Cotter-Vardeman and Adam Zwerner. Story by Adam Voiland.
References & Resources
- Better Cotton Initiative, Lacy Cotter-Vardeman and her girls. Accessed October 7, 2026.
- Dryside Dispatch (2026, September 10) Space4Ag with Tillery Sims. Accessed October 7, 2026.
- Economic Research Service (2025, January 8) Cotton and Wool – Cotton Sector at a Glance. Accessed October 7, 2026.
- National Integrated Drought Information System, Texas. Accessed October 7, 2026.
- NASA Acres (2026) On the Road with the NASA Space4Ag Tour: Listening to Agriculture Across Texas, Oklahoma, and Kansas. Accessed October 7, 2026.
- NASA, Drought. Accessed October 7, 2026.
- NASA DEVELOP (2025) Southern High Plains Texas Agriculture. Accessed October 7, 2026.
- NASA Technical Reports Server (1973) Dynamics of playa lakes in the Texas High Plains. Accessed October 7, 2026.
- NOAA, Current Drought Reduction. Accessed October 7, 2026.
- Playa Lakes Joint Venture Playas. Accessed October 7, 2026.
- Sandhills Area Research Association (2026, September 19) From Satellites to Soil: Bringing NASA Remote Sensing to West Texas Farms. Accessed October 7, 2026.
- Texas Counties Deliver, Texas Counties Interactive Map. Accessed October 7, 2026.
- Texas Water Development Board, Region O Planning Group. Accessed October 7, 2026.
- Texas Parks & Wildlife, Panhandle Playa Lakes. Accessed October 7, 2026.
- U.S. Drought Monitor (2026, September 29) National Drought Summary. Accessed October 7, 2026.
You may also be interested in:
Stay up-to-date with the latest content from NASA as we explore the universe and discover more about our home planet.
Drought in the Rio Grande basin contributed to New Mexico’s largest reservoir dwindling to its lowest level in decades.
Rainfall deficits and high temperatures have created unusually dry conditions and have spurred water shortages on much of the tropical…
Relentless rains are threatening a lake in Kenya’s Great Rift Valley that has become a key hub in the global…




NASA Sets Coverage for SpaceX 35th Station Resupply Launch, Arrival
2026-10-07 21:16
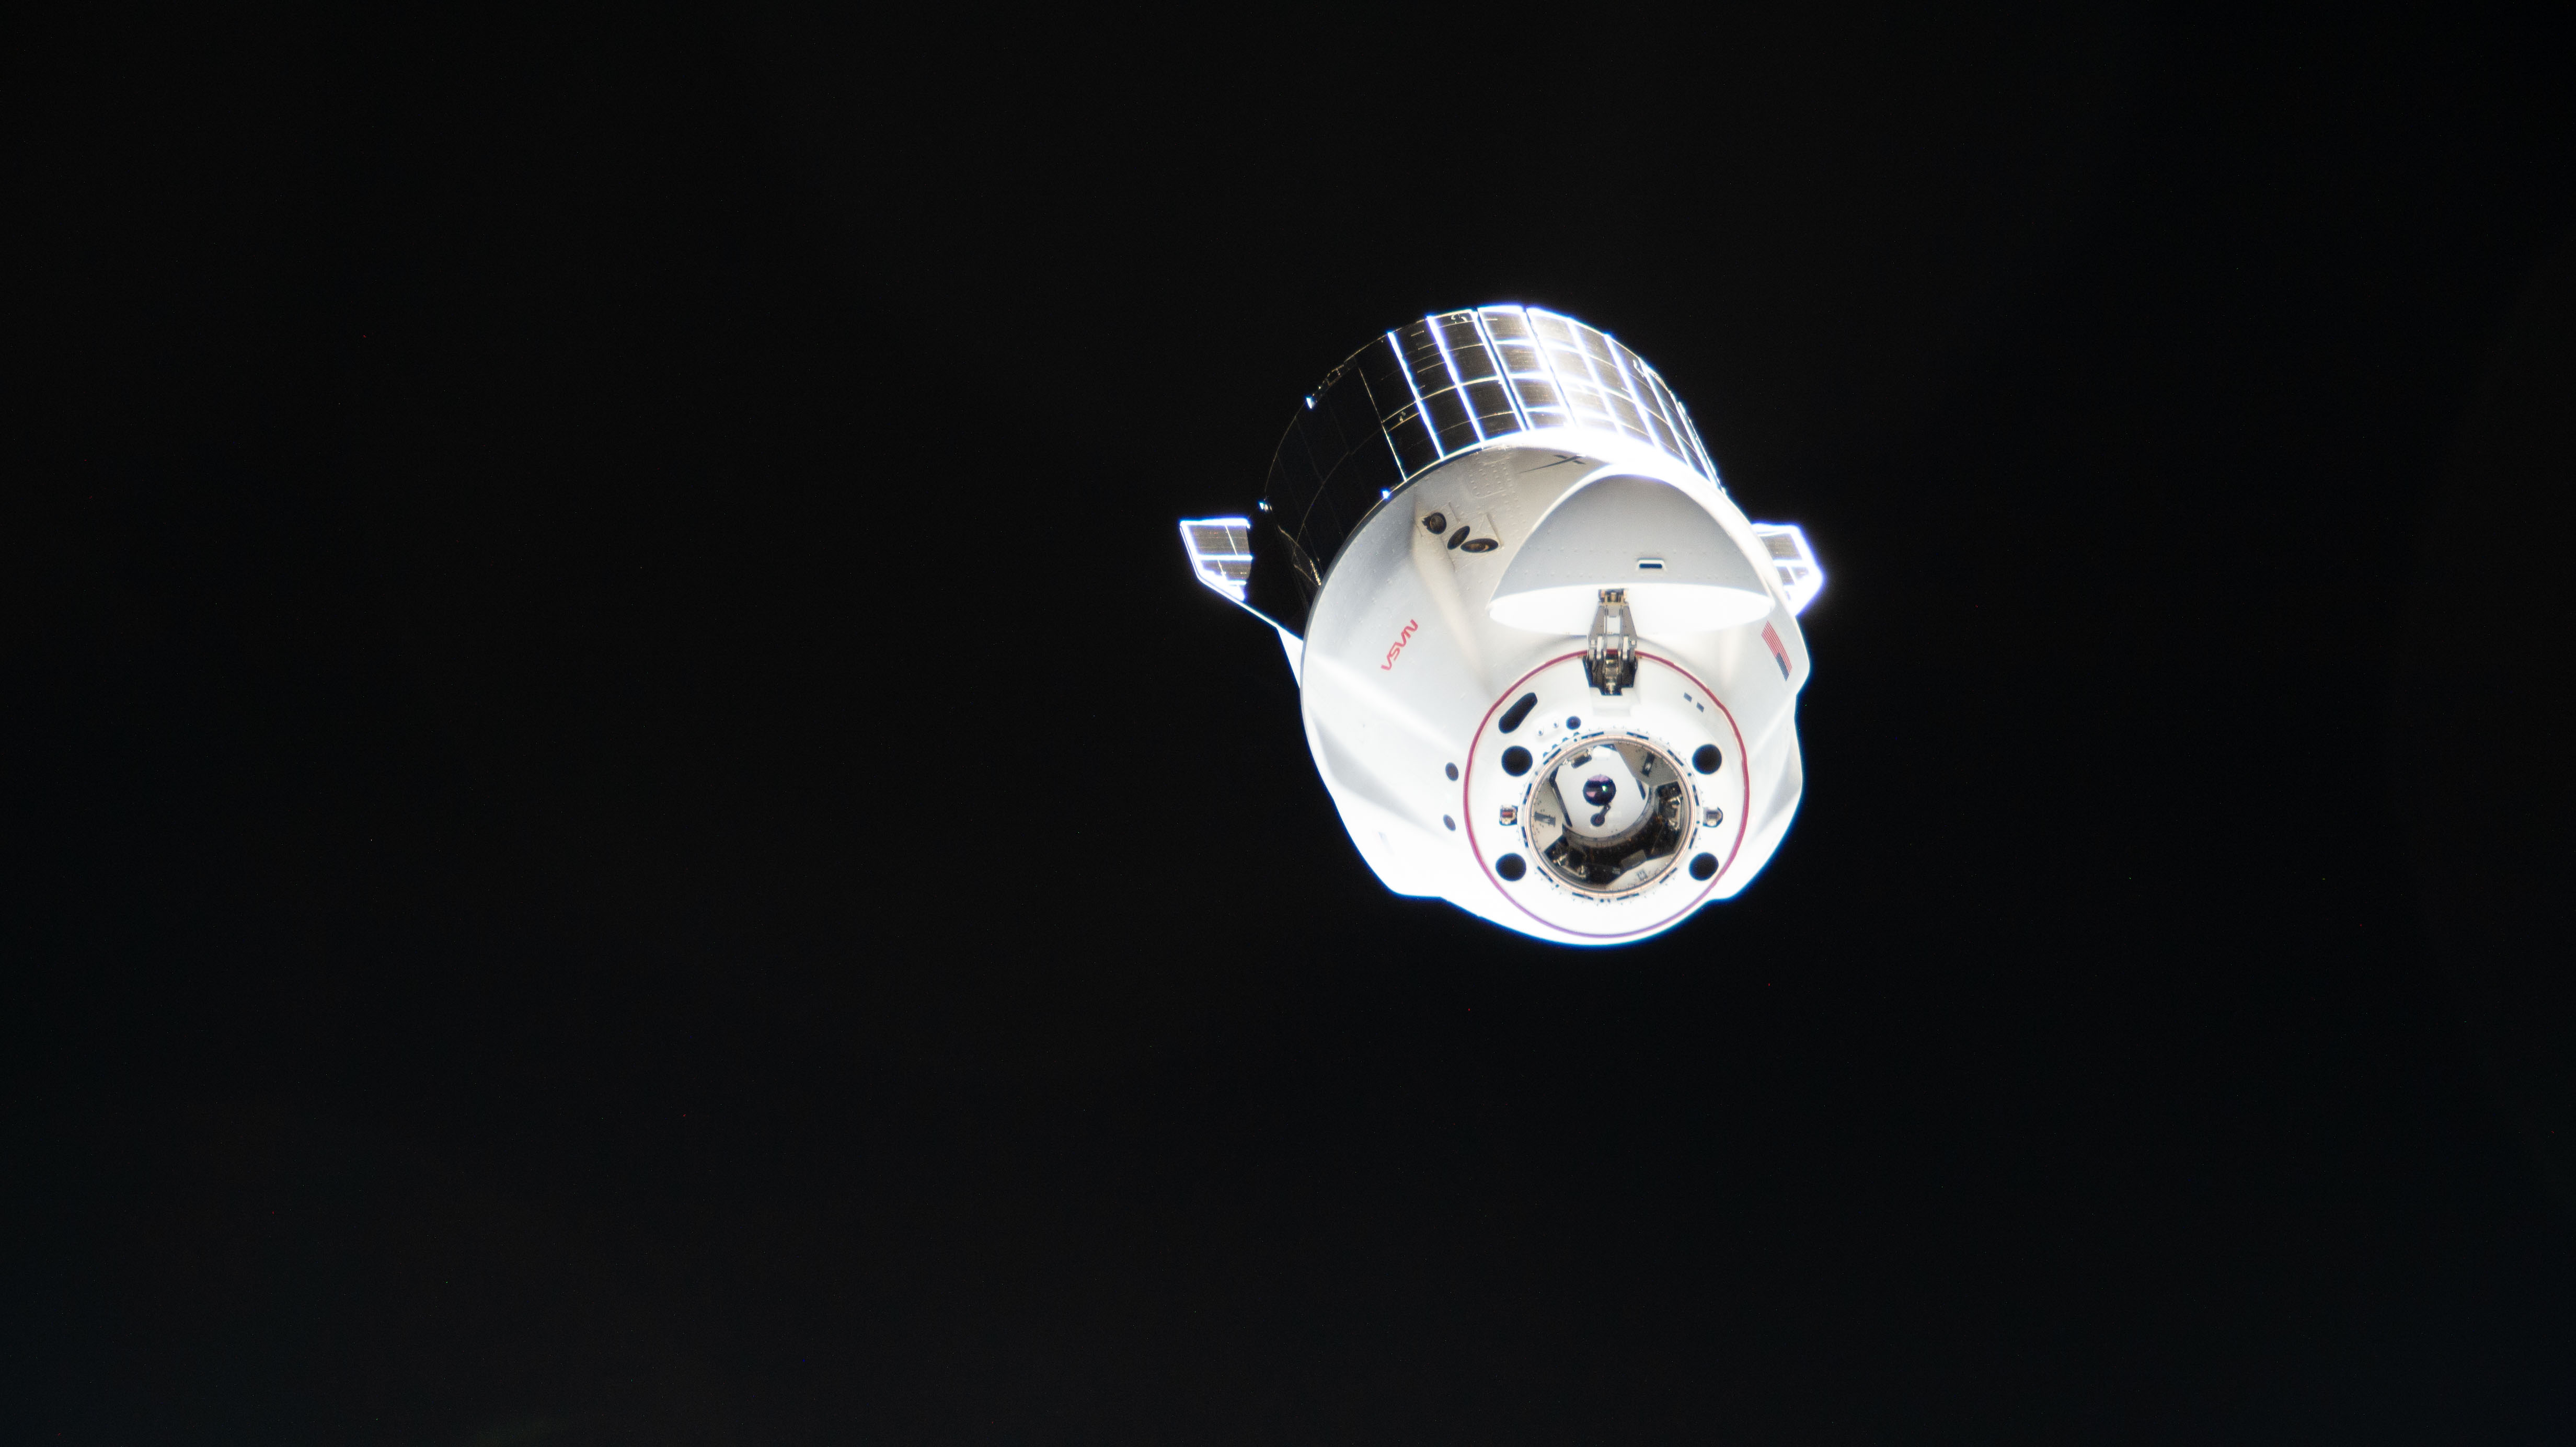
NASA and SpaceX are targeting 6:33 a.m. EDT, Tuesday, Oct. 13, for the next launch to deliver science investigations, supplies, and equipment, including the final set of International Space Station Roll-Out Solar Arrays, to the space station. This is the 35th SpaceX commercial resupply services mission to the orbital complex for NASA.
NASA also will host a media teleconference on Thursday, Oct. 8 that will preview the cargo resupply flight, as well as provide a post-splashdown update for the agency’s SpaceX Crew-12 mission, which will have returned to Earth from the space station Thursday morning.
Loaded with more than 6,300 pounds of supplies, a SpaceX Dragon spacecraft on a Falcon 9 rocket will lift off from Space Launch Complex 40 at Cape Canaveral Space Force Station in Florida. Dragon will dock autonomously around 11 a.m. on Thursday, Oct. 15, to the space-facing port of the station’s Harmony module.
NASA’s live launch and docking coverage will stream through a variety of platforms. Learn where to watch online:
In addition to the solar arrays, the Dragon spacecraft will deliver hardware to manufacture artificial retinas in microgravity to help restore vision on Earth and 3D heart tissues models to advance large‑scale drug testing on future missions. The spacecraft will carry materials to study how a new type of glass forms in microgravity and brain organoids that could reveal treatment targets for neurodegenerative diseases, such as Alzheimer’s, Parkinson’s, and multiple sclerosis.
The Dragon spacecraft is scheduled to remain at the space station until mid-November when it will depart the orbiting laboratory and return to Earth with time-critical research and cargo, splashing down off the coast of California.
NASA’s mission coverage is as follows (all times Eastern and subject to change based on real-time operations):
Thursday, Oct. 8
1:15 p.m.: International Space Station briefing for Crew-12 return, and SpaceX’s 35th Commercial Resupply Services launch with the following participants:
- Bill Spetch, deputy manager of Commercial, Low Earth Orbit Program
- Dr. Liz Warren, deputy chief scientist, NASA’s International Space Station Office
- Lee Echerd, senior mission manager, Customer Operations and Integration, SpaceX
- Andreas Mogensen, leader, Human Exploration Group, ESA (European Space Agency)
To participate in the teleconference, media must contact the NASA Johnson Space Center newsroom for call details by 12 p.m., Oct. 8, at: jsccommu@mail.nasa.gov or 281-483-5111. To ask questions, media must dial in no later than 10 minutes before the start of the call. The agency’s media credentialing policy is available online.
Tuesday, Oct. 13
6:15 a.m.: Launch coverage begins
6:33 a.m.: Launch
Thursday, Oct. 15
9:15 a.m.: Arrival coverage begins
11 a.m.: Docking
NASA website launch coverage
Launch day coverage of the mission will be available on the NASA website. Coverage will include live streaming and blog updates beginning no earlier than 6 a.m. on Oct. 13, as the countdown milestones occur. On-demand streaming video on NASA+ and photos of the launch will be available shortly after liftoff. For questions about countdown coverage, contact the NASA Kennedy Space Center newsroom at 321-867-2468. Follow countdown coverage on our International Space Station blog for updates.
Attend launch virtually
Members of the public can register to attend this launch virtually. NASA’s virtual guest program for this mission also includes curated launch resources, notifications about related opportunities or changes, and a stamp for the NASA virtual guest passport following launch.
Watch, engage on social media
Let people know you’re watching the mission on X, Facebook, and Instagram by following and tagging these accounts:
X: @NASA, @NASAKennedy, @NASASpaceOps, @Space_Station, @ISS National Lab
Facebook: NASA, NASAKennedy, ISS, ISS National Lab
Instagram: @NASA, @NASAKennedy, @ISS, @ISSNationalLab
Learn more about this commercial resupply services mission at:
https://www.nasa.gov/mission/nasas-spacex-crs-35/
-end-
Josh Finch / Jimi Russell
Headquarters, Washington
202-358-1100
joshua.a.finch@nasa.gov / james.j.russell@nasa.gov
Steven Siceloff
Kennedy Space Center, Fla.
321-876-2468
steven.p.siceloff@nasa.gov
Sandra Jones / Joseph Zakrzewski
Johnson Space Center, Houston
281-483-5111
sandra.p.jones@nasa.gov / joseph.a.zakrzewskI@nasa.gov
NASA’s SpaceX 35th Commercial Resupply Mission Overview
2026-10-07 20:17
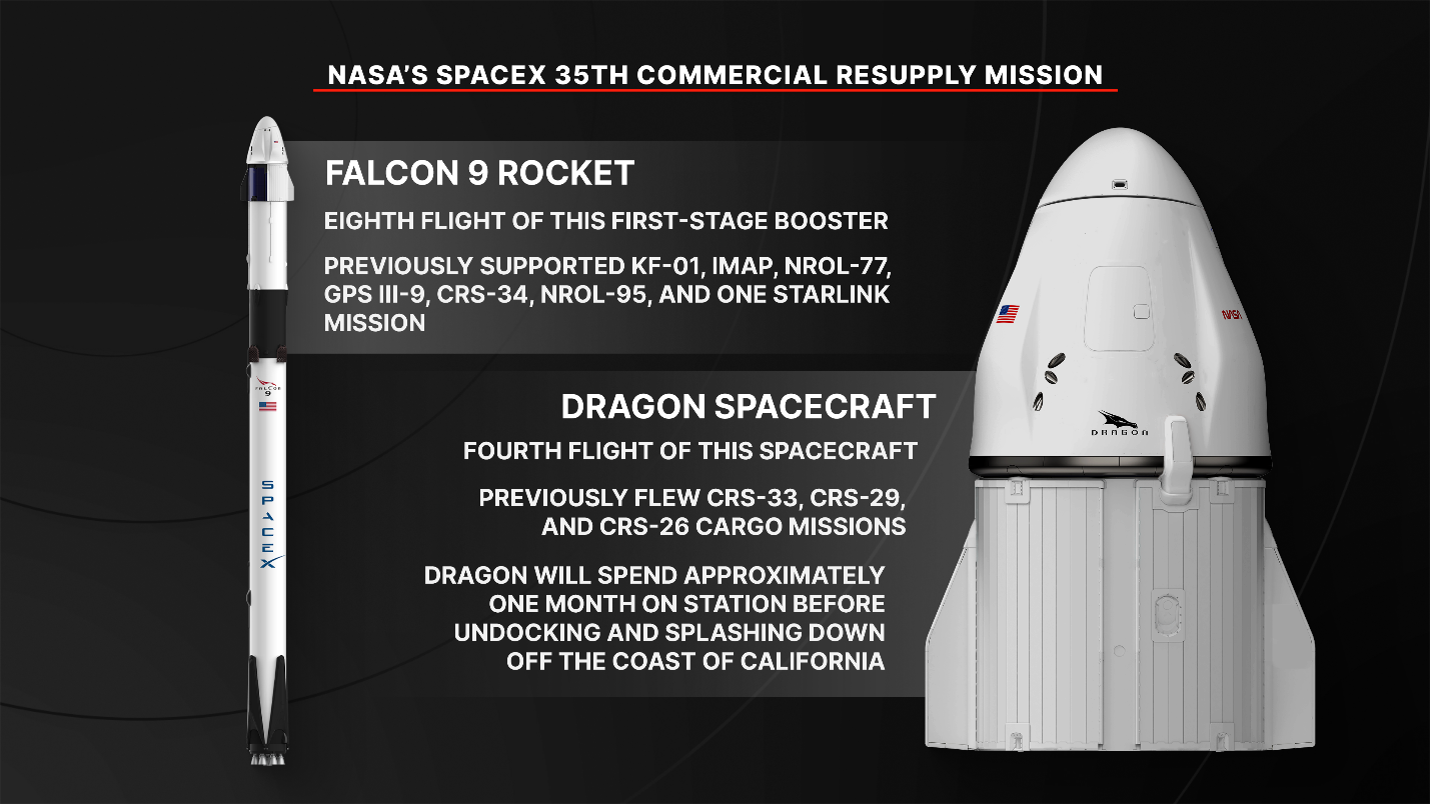
NASA and SpaceX are targeting no earlier than Tuesday, Oct. 13 to launch scientific investigations, supplies, and equipment to the International Space Station.
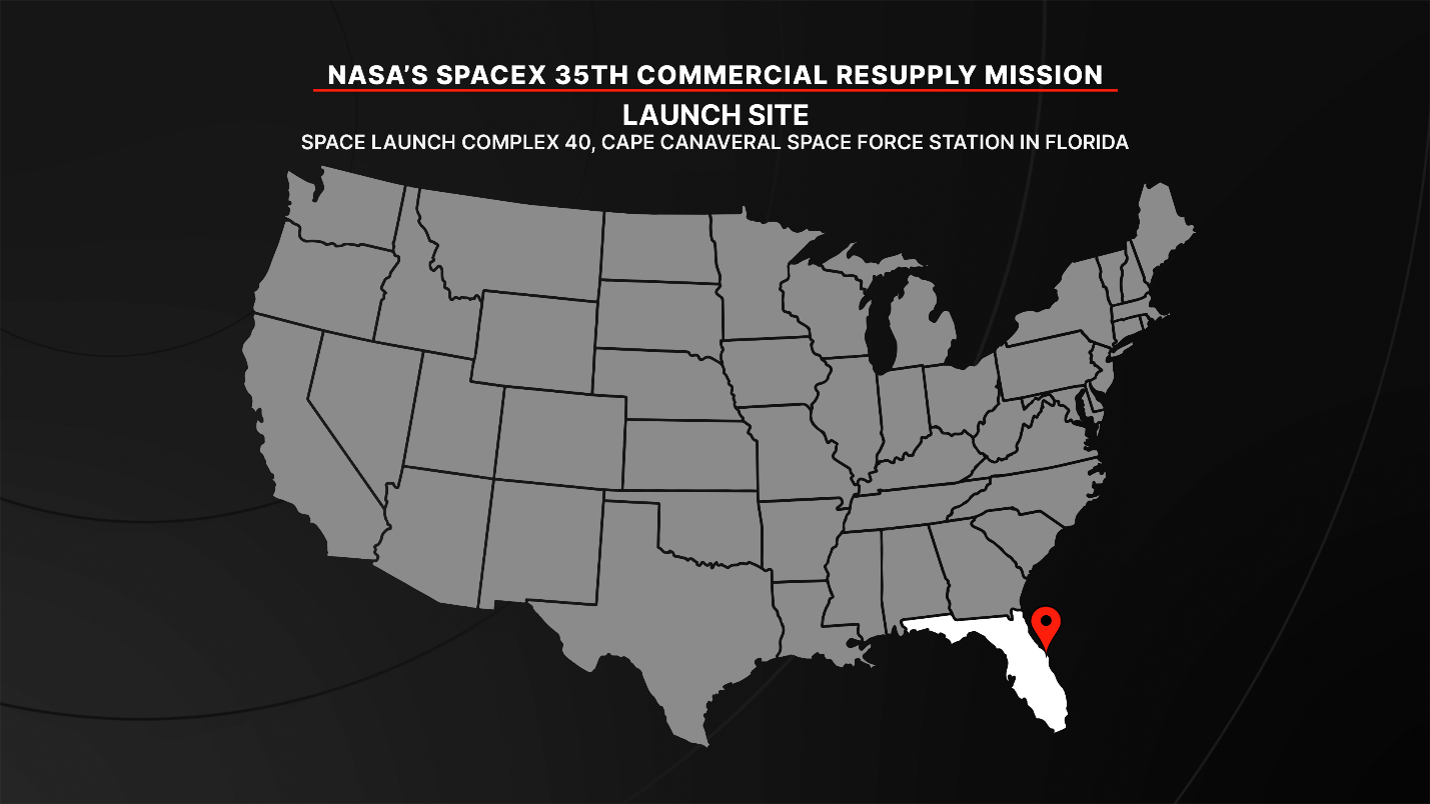
Loaded with more than 6,300 pounds of supplies, the SpaceX Dragon spacecraft will lift off aboard the company’s Falcon 9 rocket from Space Launch Complex 40 at Cape Canaveral Space Force Station in Florida. Following its arrival to the orbital complex, Dragon will autonomously dock to the space-facing port of the space station’s Harmony module.
NASA will stream launch and docking coverage through a variety of platforms. Learn where to watch online:
For more than 25 years, the International Space Station has supported research by scientists from more than 110 countries, enabling more than 4,000 experiments in microgravity. Research conducted aboard the station helps advance long-duration missions to the Moon as part of the Artemis program and to Mars, while also providing multiple benefits to humanity.
Science Highlights
In addition to cargo for the crew aboard the space station, Dragon will deliver several new science experiments, including:
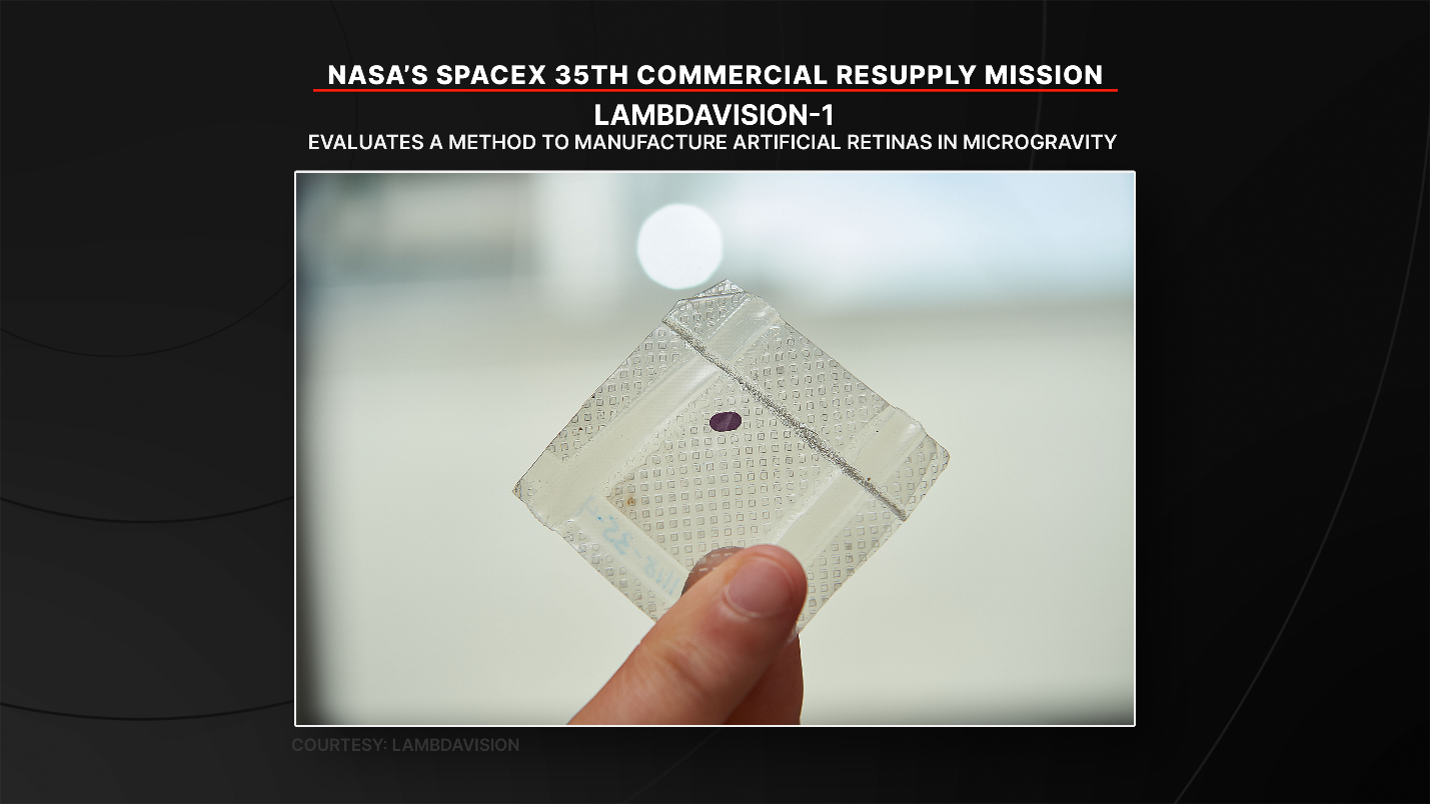
With LambdaVision-1, NASA is testing how to manufacture artificial eye retinas in microgravity, building them one thin layer at a time. Reduced settling in microgravity may create more uniform, stable layers, potentially improving implants’ performance. These artificial retinas could help restore vision for patients with currently incurable retinal diseases on Earth.
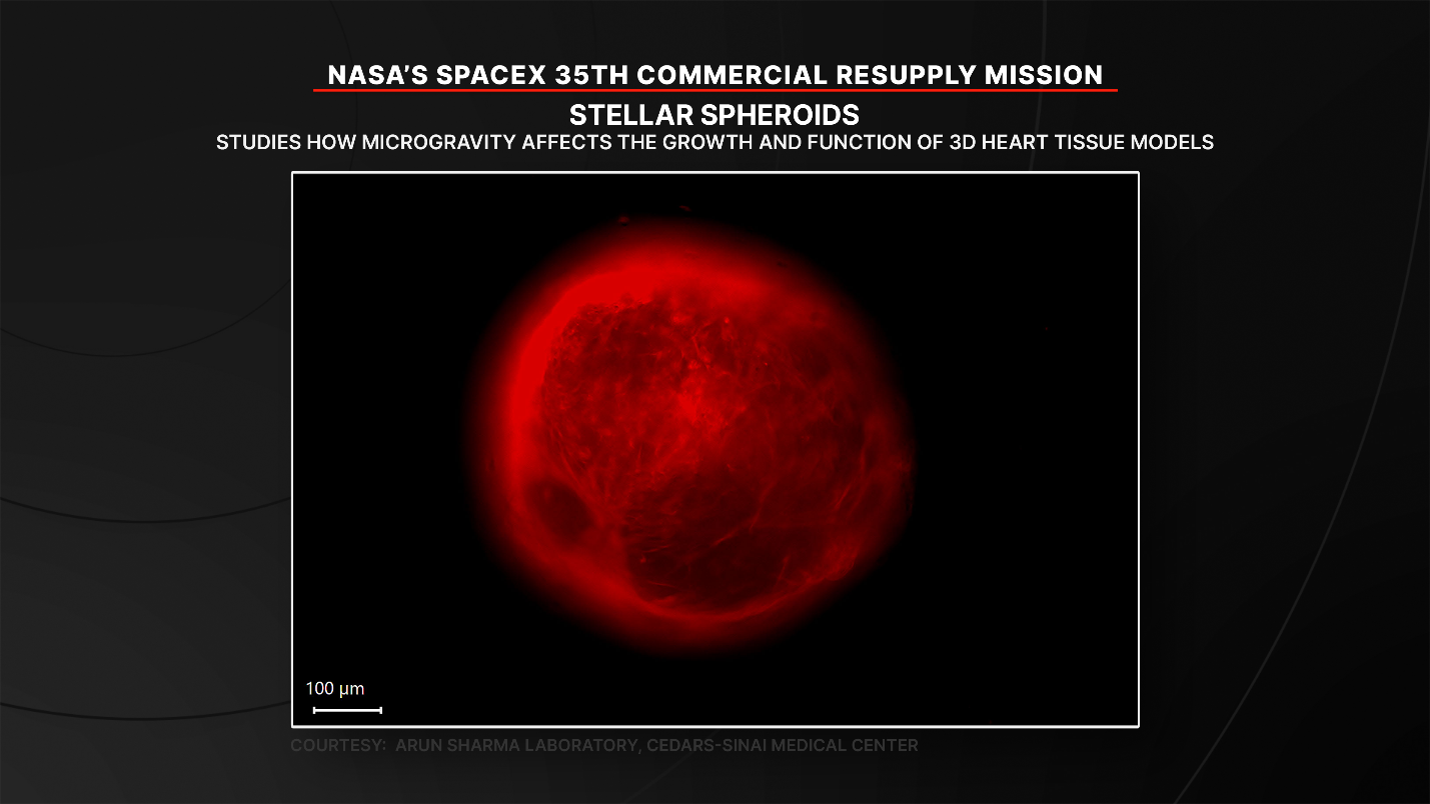
NASA will use the Stellar Spheroids experiment to study how microgravity affects the growth and function of 3D human heart tissue models. Researchers will assess whether microgravity improves the formation of advanced vascular networks. Results could help researchers develop more realistic heart tissue models for disease research and support larger‑scale drug testing on future space missions.
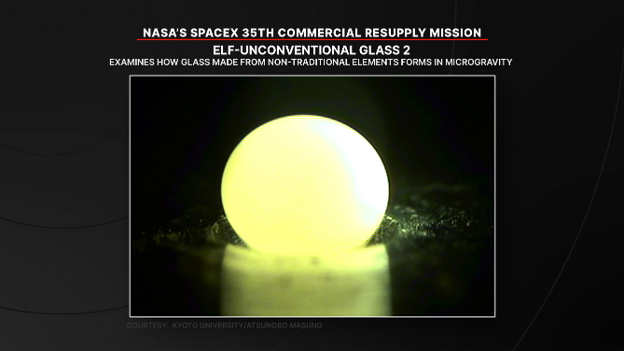
Using non-traditional elements, ELF-Unconventional Glass 2 studies how glass forms in microgravity. Researchers will observe molten behavior in space, then return solid samples to Earth for detailed analysis. These unconventional glasses could offer higher strength, improved optical capabilities, and greater durability for spacecraft, habitats, and other exploration technologies.
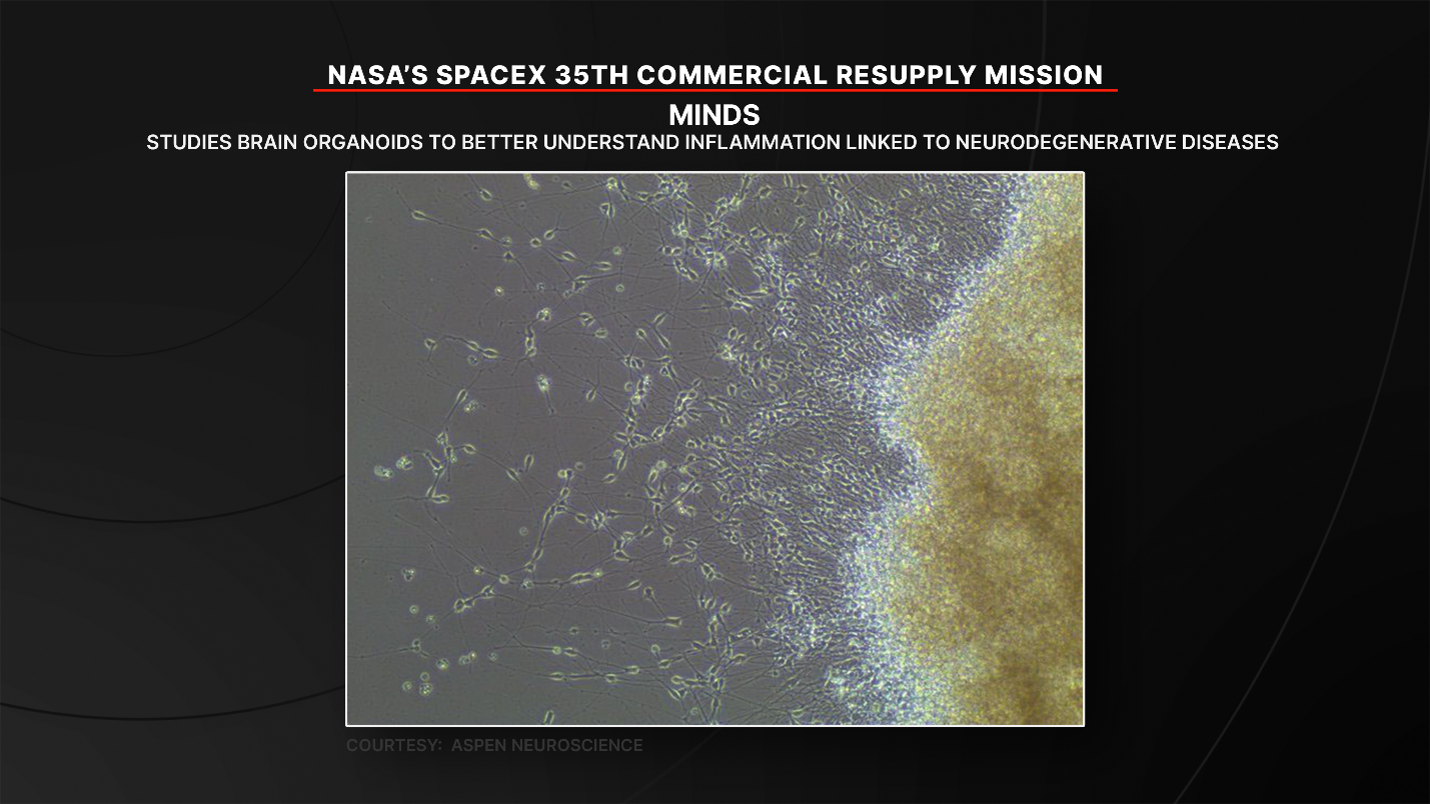
The MINDS experiment studies brain organoids to better understand inflammation linked to neurodegenerative diseases. The investigation uses “organoid villages,” which combine cells from multiple people to better represent patient diversity. Results could help identify new treatment targets for diseases like Alzheimer’s, Parkinson’s, and multiple sclerosis.
Arrival and Return
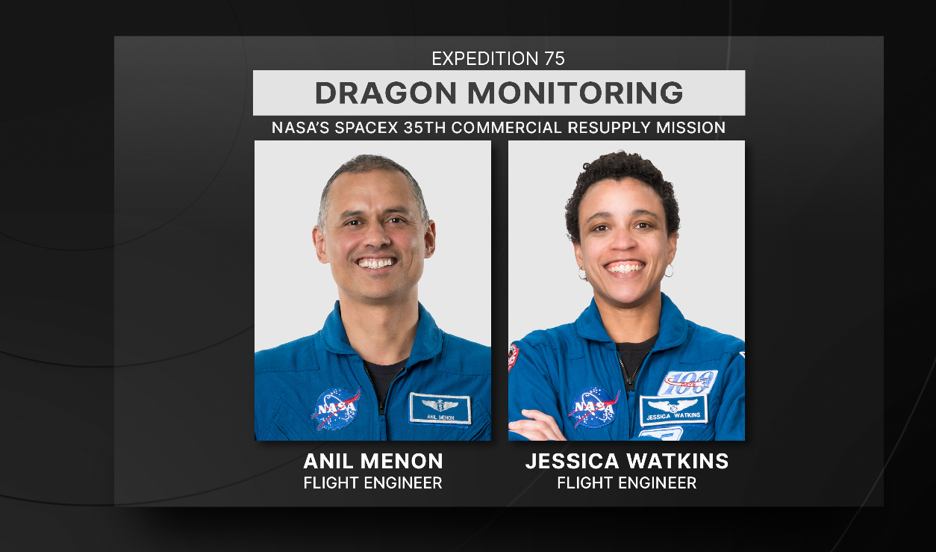
NASA astronauts Anil Menon and Jessica Watkins will monitor the Dragon spacecraft’s arrival. It will remain docked to the orbiting laboratory for about a month before splashing down in the Pacific Ocean, returning critical science and hardware to teams on Earth.
Cargo Highlights
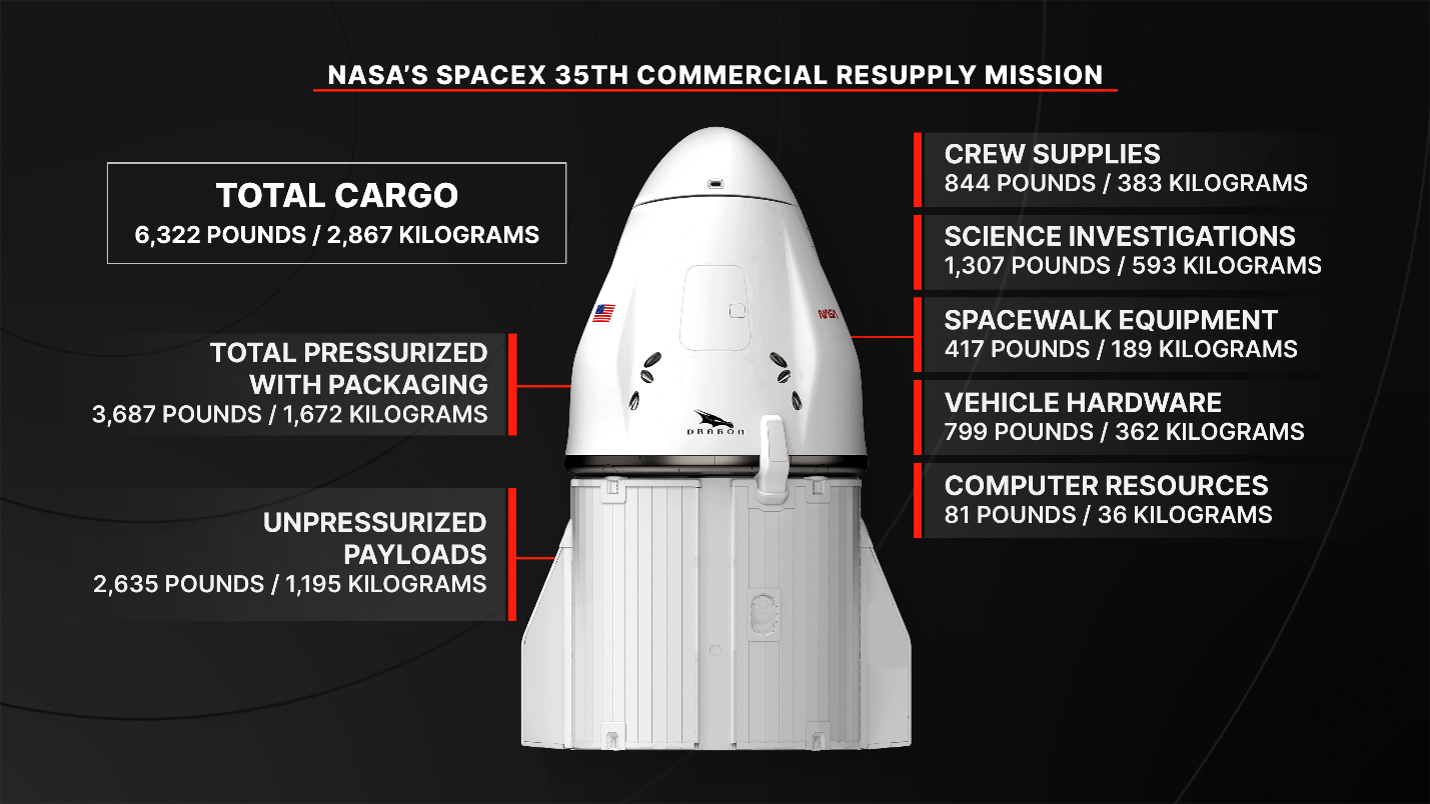
Launch
International Space Station Roll-Out Solar Arrays (IROSA) – The final pair of IROSAs that will be installed on the space station, completing the augmentation of its power system to support critical operations, including its safe and controlled deorbit.
Collapsible Continency Urinal and supporting hardware – A demonstration and test unit supporting NASA’s Artemis III mission.
Canadarm2 joint flight support equipment – A large foam clamshell will fly empty to return the failed robotic arm joint that was replaced during a June 30 spacewalk. After its return to Earth, teams will analyze the joint on the ground.
Additional equipment launching includes a toilet dose pump, a toilet pretreat quality sensor, and a robot micro-conical tool used for space station maintenance and utilization tasks with external replacement units and payloads.
Return
When Dragon returns in mid‑November, it will bring back the failed joint on the Canadarm2 for analysis and refurbishment, a spacesuit for ground refurbishment, a fluid- and pressure-control pump assembly from the urine processor, and a filtration unit for the water processor assembly.
NASA’s PRIMA Spacecraft (Artist’s Concept)
2026-10-07 20:15
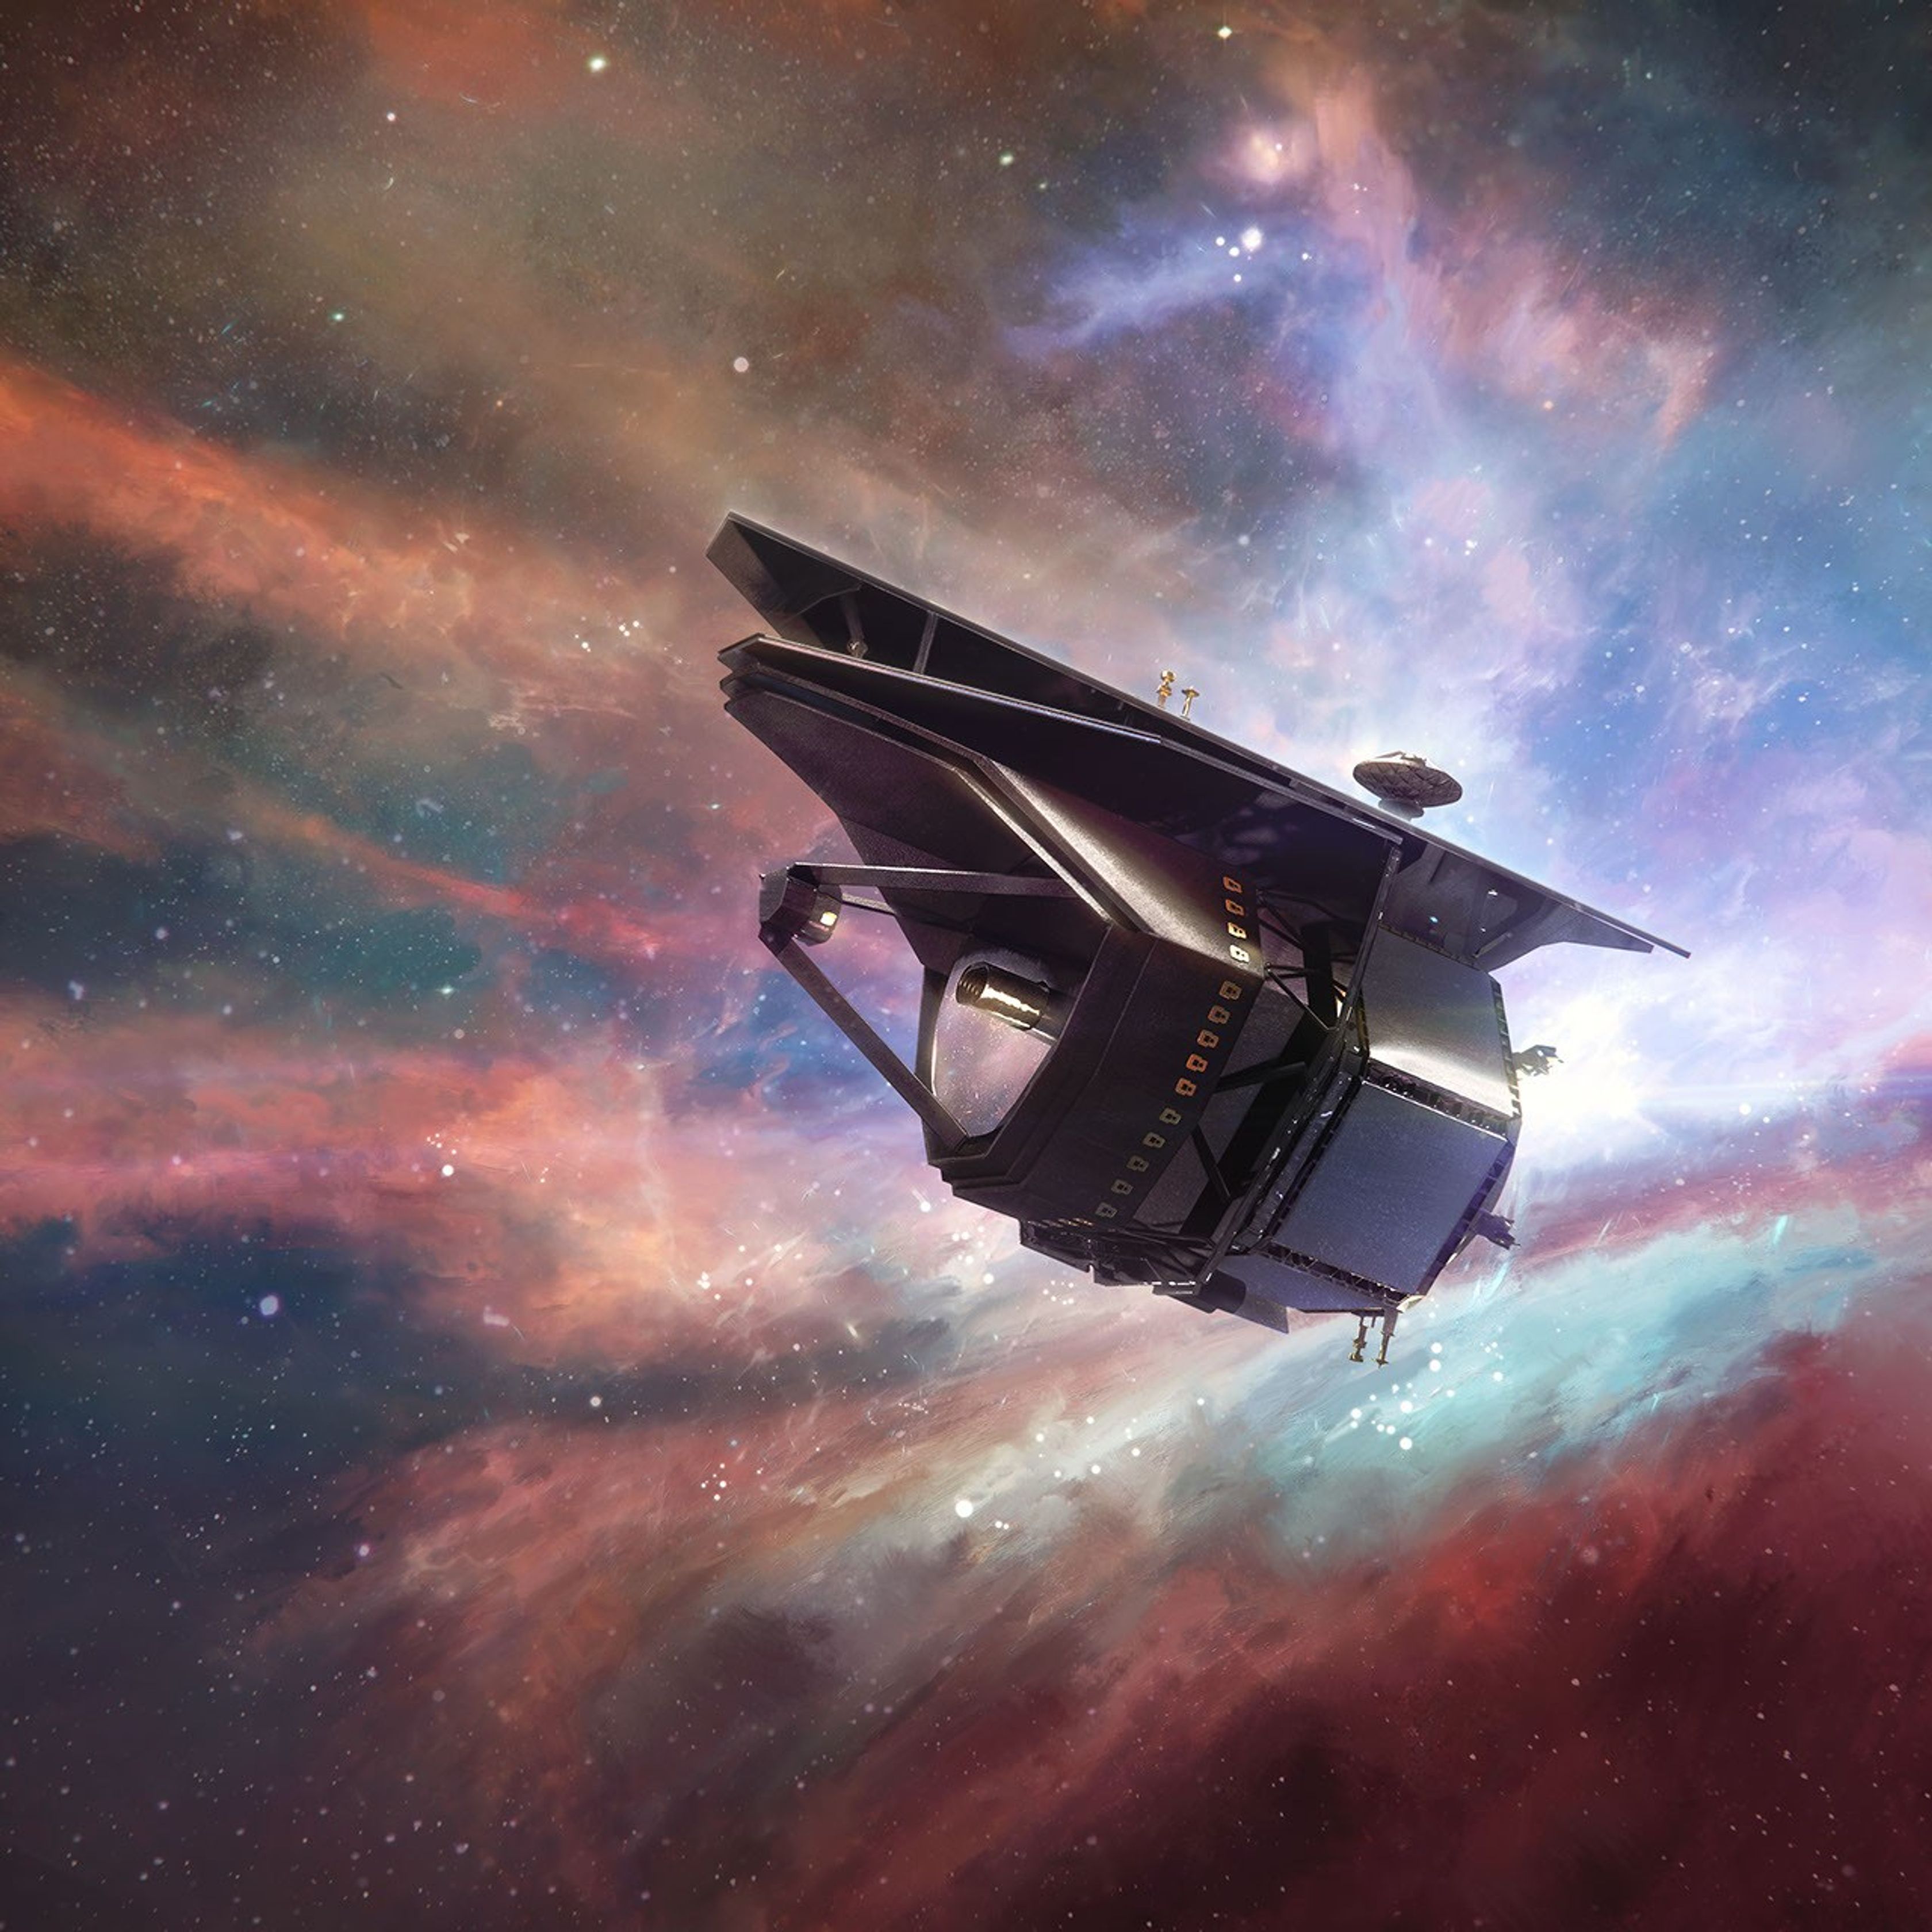
NASA’s PRIMA Spacecraft (Artist’s Concept)
NASA/JPL-Caltech
Description
This artist’s concept depicts the proposed design for NASA’s PRobe far-Infrared Mission for Astrophysics (PRIMA), which was selected by the agency in September 2026. The PRIMA observatory is the first in a new class of NASA astrophysics missions, called Probe Explorers, within the agency’s longstanding Explorers Program. By observing far-infrared light, PRIMA will enable scientists to study cosmic objects heavily obscured by dust, providing new insights into the formation of planets, stars, and black holes, and even how water on Earth came to be. If confirmed by the agency, PRIMA will be targeted to launch in 2033, for a planned five-year mission.
TechCrunch - Latest
Last call to volunteer at TechCrunch Founder Summit 2026
2026-10-08 13:00
Amazon unveils new Alexa tablets with Alexa+ and Google Play Store access
2026-10-08 13:00
Uber and China’s Pony.ai plan to launch robotaxis in London
2026-10-08 12:53
Vesta raises $30M to bring swarms of agents to mortgage lenders
2026-10-08 12:00
India rejects Elon Musk’s claim of discrimination over Starlink launch
2026-10-08 06:14


